The first time you write a Python script that opens an Excel file, transforms 10,000 rows, and saves a formatted report — all in under three seconds — something clicks that no amount of VLOOKUP practice ever could.
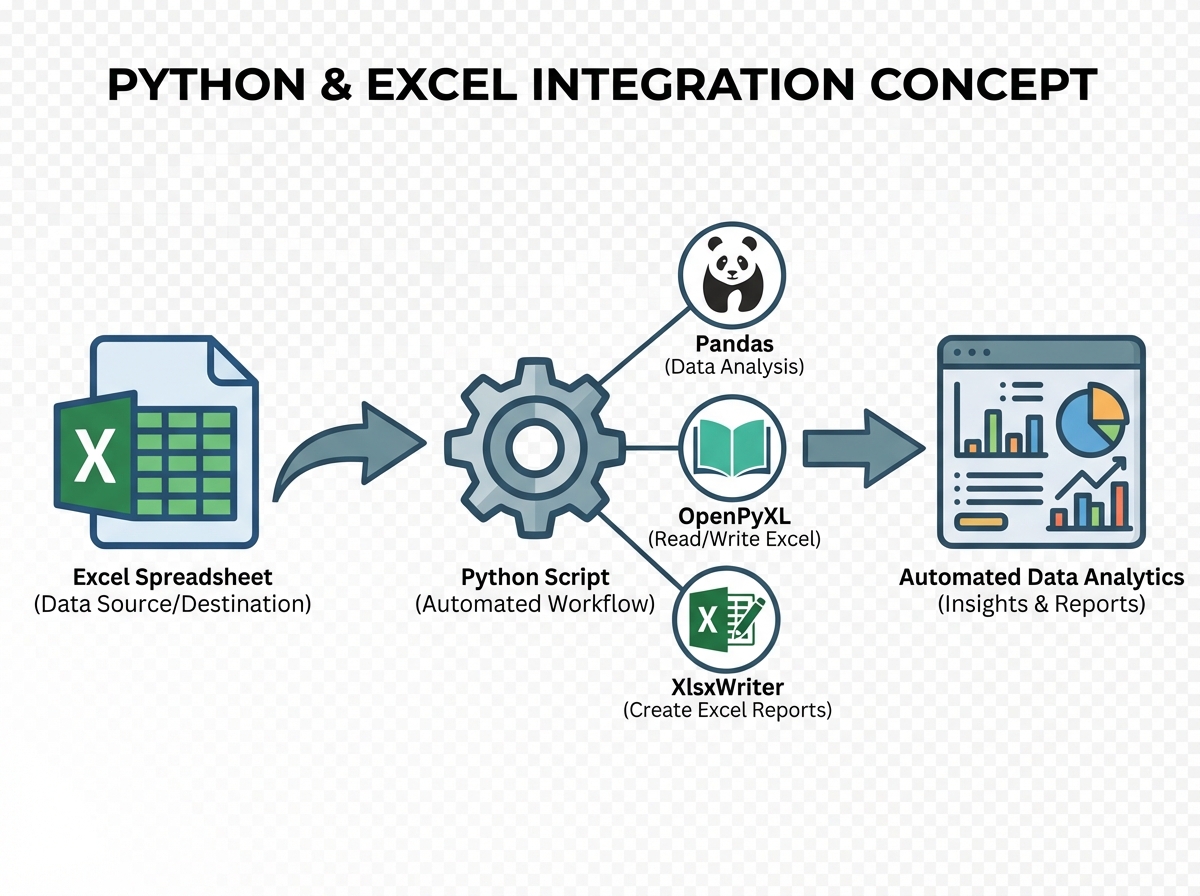
If you’re looking to learn Python and Excel integration for data analytics, the short answer is this: you don’t have to choose between the two tools. Excel is where your stakeholders live. Python is where the real processing happens. Learning to connect them — using libraries like Pandas, OpenPyXL, and XlsxWriter — turns what used to be a two-hour manual task into a script you run before your morning coffee.
- Works best if you already use Excel regularly but feel capped by what formulas alone can do
- The payoff is automation: monthly reports, sales dashboards, and data cleaning pipelines that run without you touching a single cell
- You don’t need to be a Python expert to start — but you do need to stop treating Excel and Python as separate worlds
What Python-Excel Integration Actually Means
Python-Excel integration is the practice of using Python scripts to read, write, manipulate, and format Excel workbooks programmatically — replacing manual spreadsheet work with repeatable, auditable code. For a working analyst, this means your pivot tables get rebuilt automatically, your charts update with fresh data, and your formatted reports land in a folder without you opening Excel once.
Three libraries do most of the heavy lifting:
| Library | What It Does | Best For |
|---|---|---|
| Pandas | Reads/writes Excel, manipulates data as DataFrames | Data transformation, analysis, merging datasets |
| OpenPyXL | Reads and writes .xlsx files with full formatting control |
Modifying existing workbooks, applying styles, formulas |
| XlsxWriter | Creates new .xlsx files with charts and formatting |
Generating polished reports from scratch |
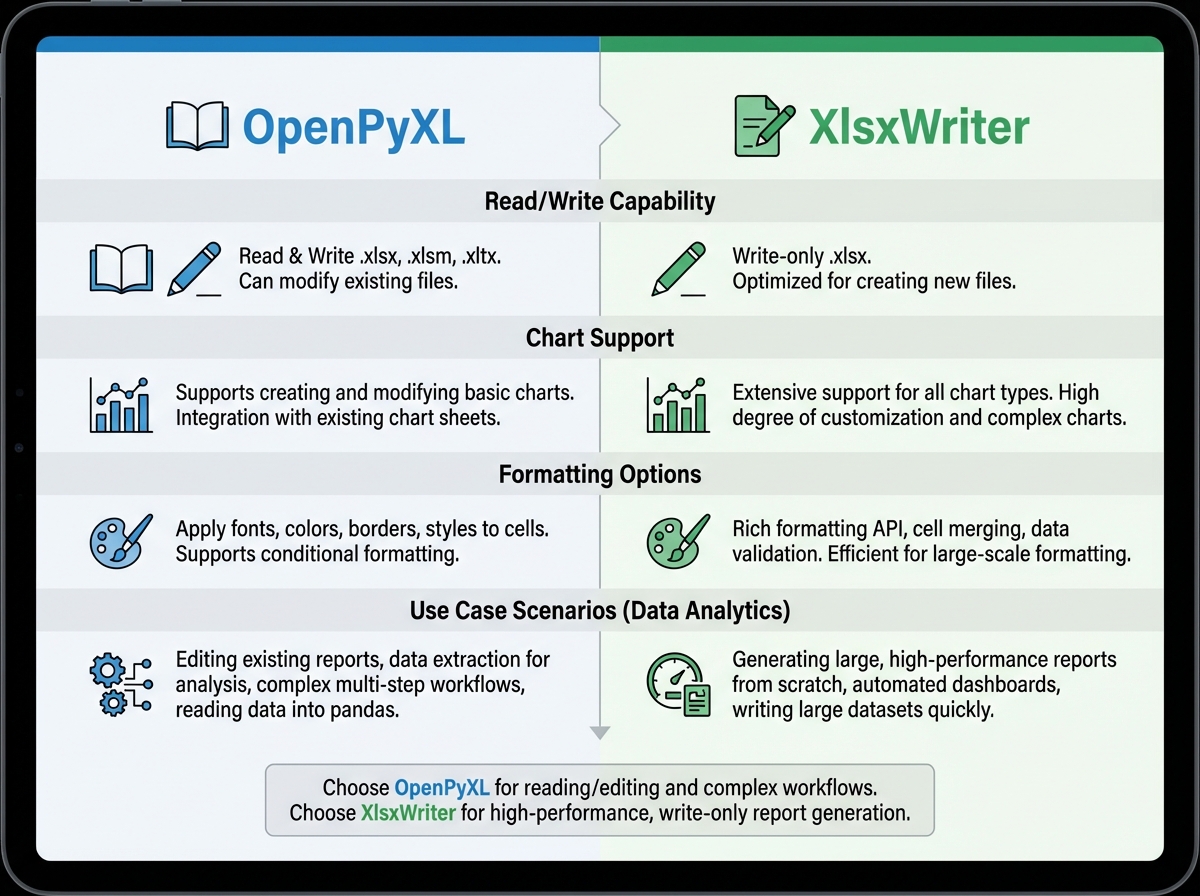
OpenPyXL handles modification of existing files, while XlsxWriter is write-only but produces more sophisticated charts. Pandas wraps both and adds the analytical muscle in between.
Three Things That Surprise Every Analyst
- Excel’s formula engine stops at the file boundary — Pandas doesn’t.
- You can generate a fully formatted, multi-sheet Excel report without ever opening Excel.
- OpenPyXL can read an existing workbook and preserve every style while injecting new data into specific cells.
Where Most People Start — and Why It Stalls
The single biggest mistake people make when learning Python-Excel integration is treating Excel as a data store and Python as a calculator, running everything in isolation. They export a CSV, process it in Python, then manually paste results back into Excel — which defeats the entire point. Nothing is automated. Nothing is repeatable. And when the source data changes on Monday, they’re doing the whole thing again by hand.
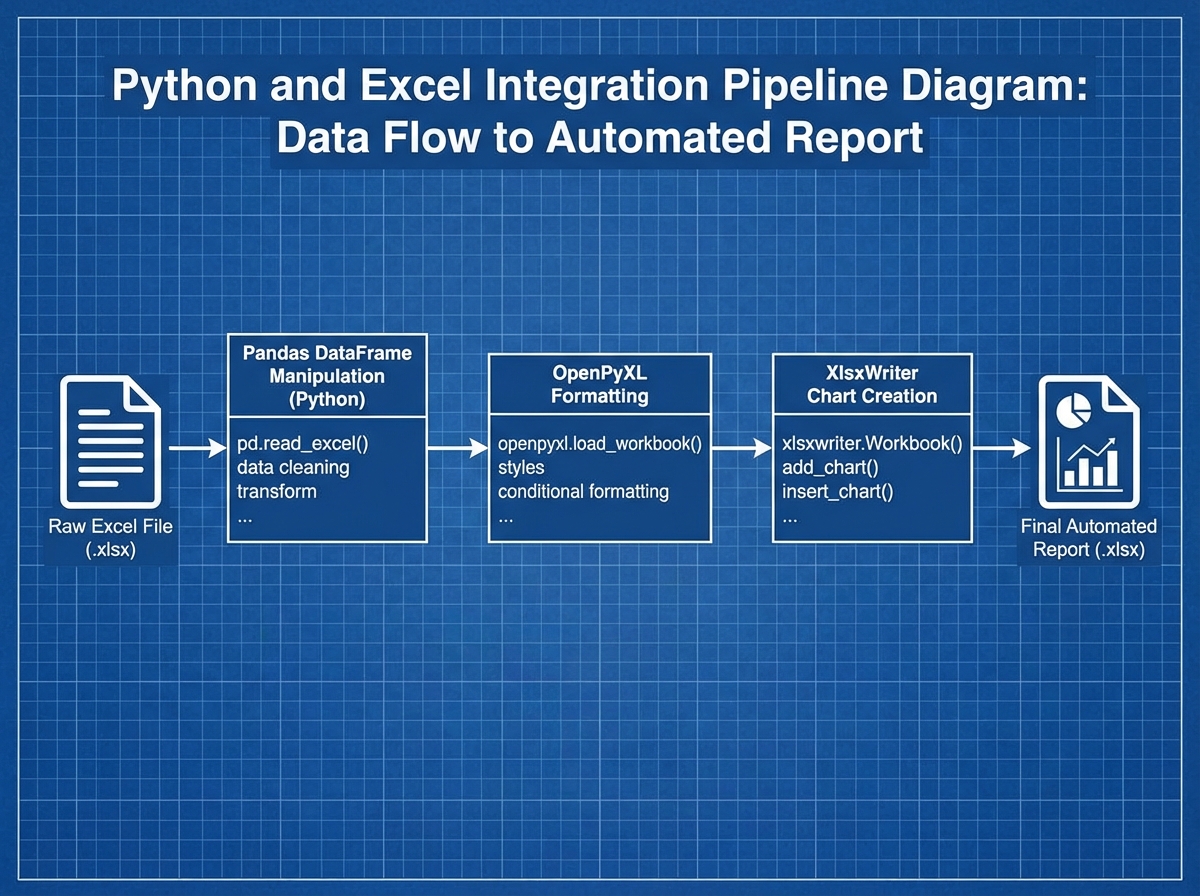
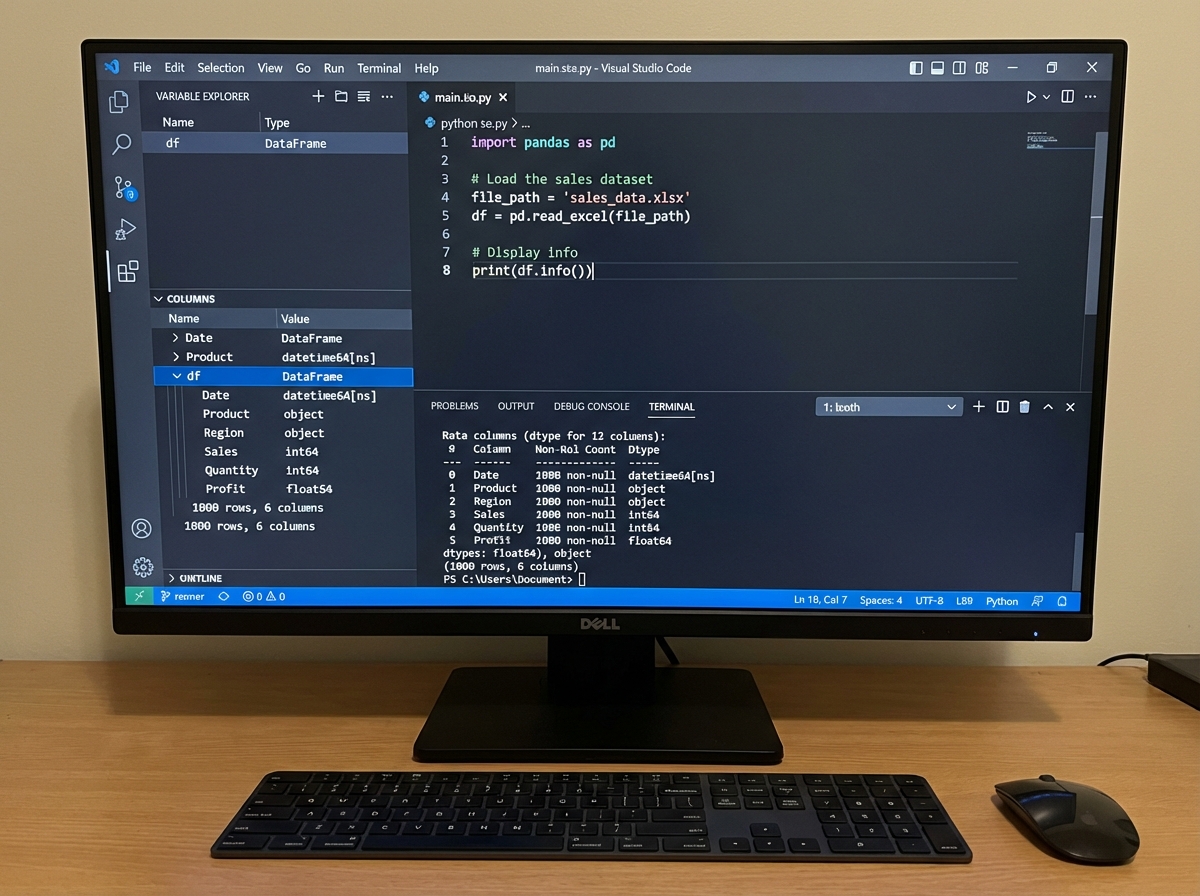
The breakthrough comes when you stop exporting and start connecting. pd.read_excel() reads your file directly into a DataFrame. df.to_excel() writes it back with one line. From that moment, the pipeline is closed — data flows in, gets transformed, flows out, and Excel sees only the finished product.
Most people also skip the Excel side entirely, assuming their existing spreadsheet knowledge is good enough. It rarely is. Pivot tables with programmatic refresh cycles behave differently than manual ones. Dynamic named ranges become critical when your data grows by a thousand rows every week. If you don’t understand how Excel handles those structures natively, your Python code will produce technically correct output that breaks the moment someone sorts a column.
The Excel Foundation You Can’t Skip
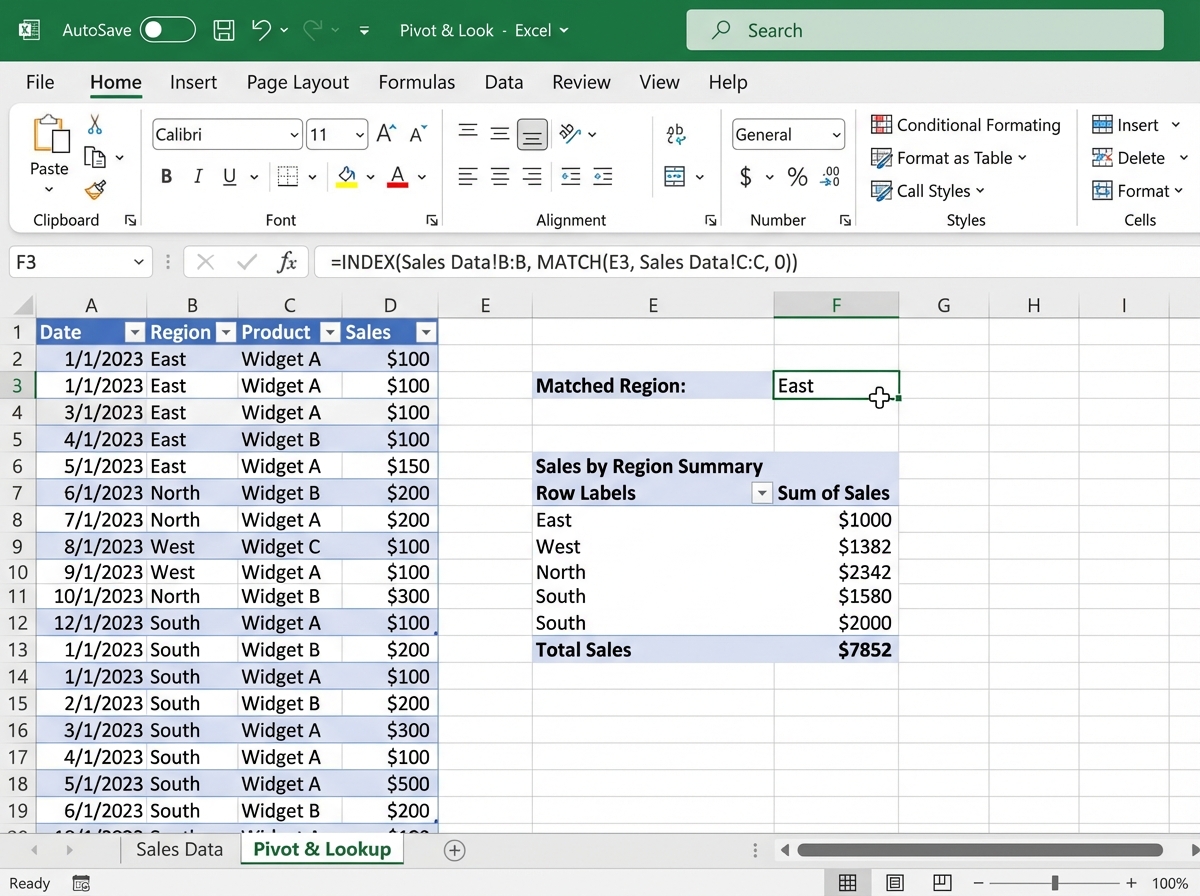
Spending time on Excel before touching Python isn’t a detour — it’s load-bearing. Specifically, the things worth understanding deeply are dynamic ranges, LOOKUP functions (VLOOKUP, INDEX-MATCH, XLOOKUP), and pivot tables. Not because you’ll use them in your Python code directly, but because when your Python output lands in an Excel file, a stakeholder is going to interact with it using exactly those tools.
Array formulas are the other one. When you first see =SUM(IF(...)) entered with Ctrl+Shift+Enter, it looks like a quirk. When you realize Pandas .groupby() is solving the exact same problem — applying a conditional aggregation across a range — the mental model snaps into place. Advanced Excel teaches you what the analytical problems are. Python teaches you a better way to solve them.
Conditional formatting and pivot charts round out the picture. OpenPyXL can apply both programmatically, but you need to understand what you’re applying and why before you can write the code that applies it. For analysts who want to go deeper on Excel-level data manipulation patterns before adding Python to the mix, the foundational concepts transfer directly.
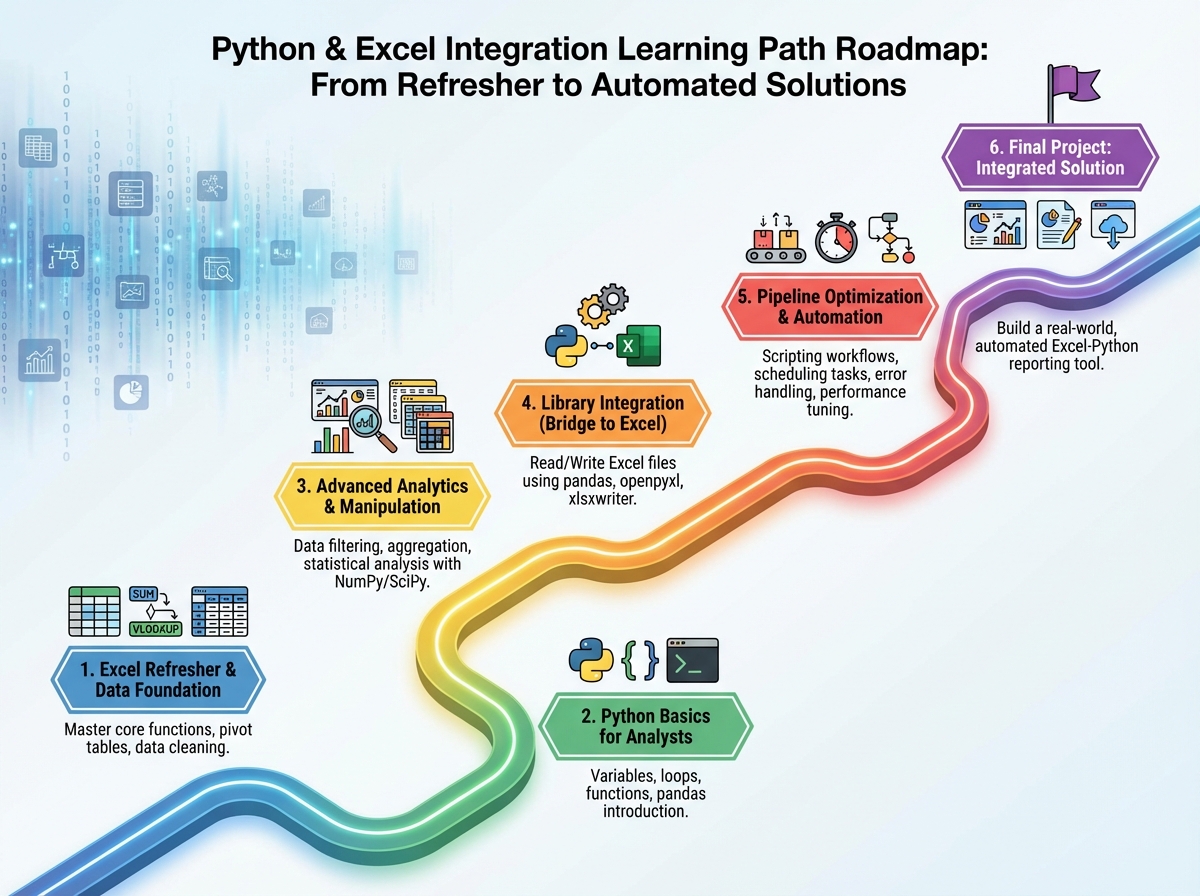
How Long This Actually Takes
| Stage | Content | Time |
|---|---|---|
| Excel foundations | Functions, pivot tables, dynamic ranges, LOOKUP | 1–2 weeks |
| Python basics | Syntax, data types, control flow, OOP fundamentals | 1–2 weeks |
| Advanced Excel for analytics | Array formulas, regex functions, dynamic plots | 1 week |
| Python for data analytics | Pandas, visualization, statistical analysis | 2–3 weeks |
| Python-Excel integration | OpenPyXL, XlsxWriter, automated reports | 1–2 weeks |
| Workflow optimization | Pipelines, caching, parallel processing | 1 week |
| Total | Full integration skill set | 7–11 weeks |
The order here matters more than the speed. Jumping straight into OpenPyXL before you can write a clean Python function means debugging two things at once — the library and the logic. If you find yourself spending three weeks on the Python basics section, that’s not falling behind — that’s building the foundation that makes everything after it stick.
Python Basics Don’t Need to Be Perfect
There’s a trap where you spend six weeks trying to master Python before touching anything Excel-related. You don’t need generators or decorators to automate a sales report. What you actually need: variables, loops, conditionals, functions, and a working understanding of how to import a library and read its documentation.
The two things that matter most are lists (because DataFrames are built on them) and dictionaries (because that’s how Pandas maps column names to data). Once you can write a loop that opens a file, processes each row, and writes results somewhere else — you have everything you need to start the integration work. Classes and object-oriented programming matter later, when you’re building reusable tools. Not on day one.
File handling deserves more attention than most beginner resources give it. Reading and writing text files, understanding paths, managing encodings — these feel boring until you’re debugging a UnicodeDecodeError at midnight before a report deadline. Build that muscle early.
Where Pandas Changes Everything
The first time you run df.groupby('Region')['Revenue'].sum() on a dataset that took you twenty minutes to summarize in a pivot table, the reaction is almost always the same: disbelief at the speed, followed immediately by the realization that you’ve been doing this wrong for years.
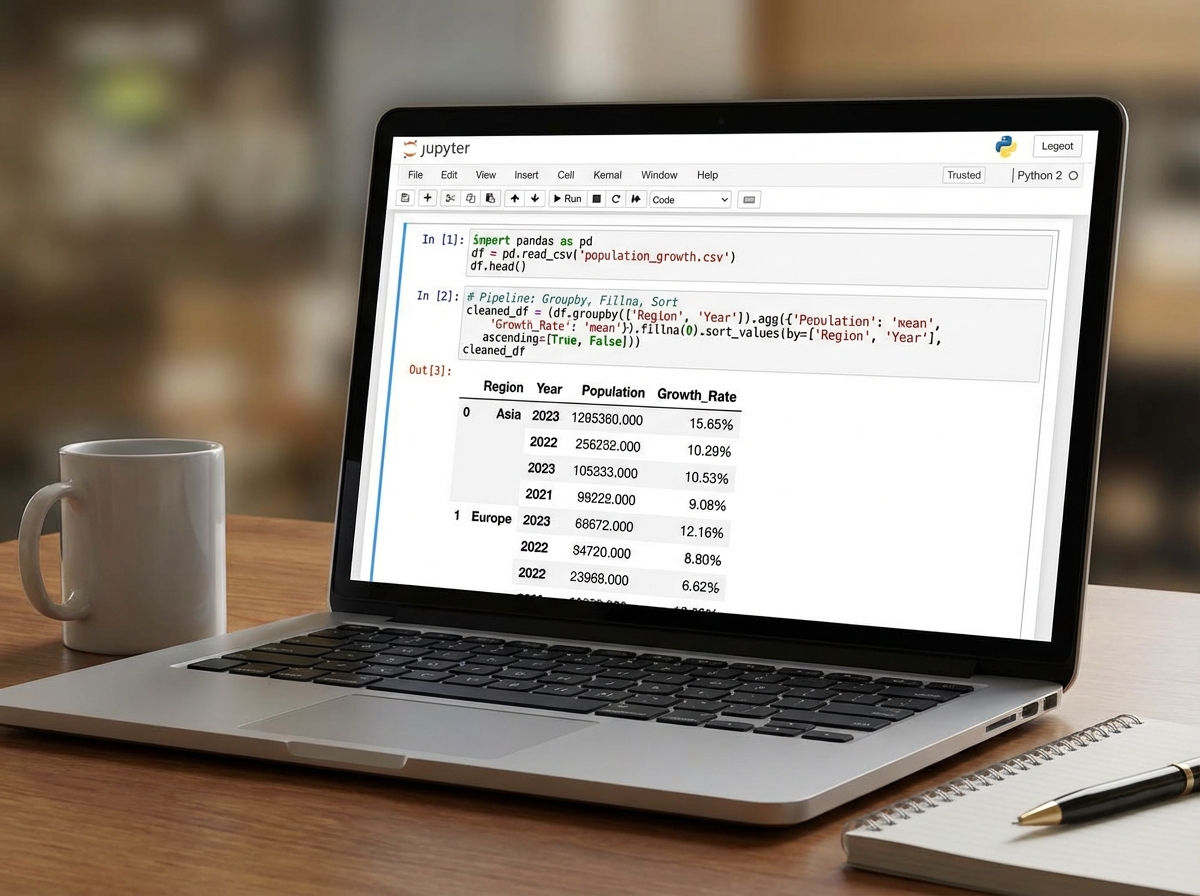
Pandas DataFrames are the core unit of Python-Excel integration work. Everything flows through them — reading in data, cleaning it, transforming it, running statistical analysis, and writing it back out. The operations that matter most in practice aren’t the exotic ones: it’s merge(), groupby(), fillna(), apply(), and to_excel(). Those five cover probably 80% of real-world analyst automation tasks.
Advanced data manipulation in Pandas — chained operations, multi-level indexing, custom aggregation functions — becomes necessary as soon as your datasets have any real complexity. The population growth analysis project is where this becomes visceral: you’re not cleaning a toy dataset anymore, you’re handling messy real-world data with missing values, inconsistent date formats, and multiple source files that need to be reconciled. That’s the moment Pandas stops feeling like a library and starts feeling like a skill.
Writing Back to Excel Without Breaking the File
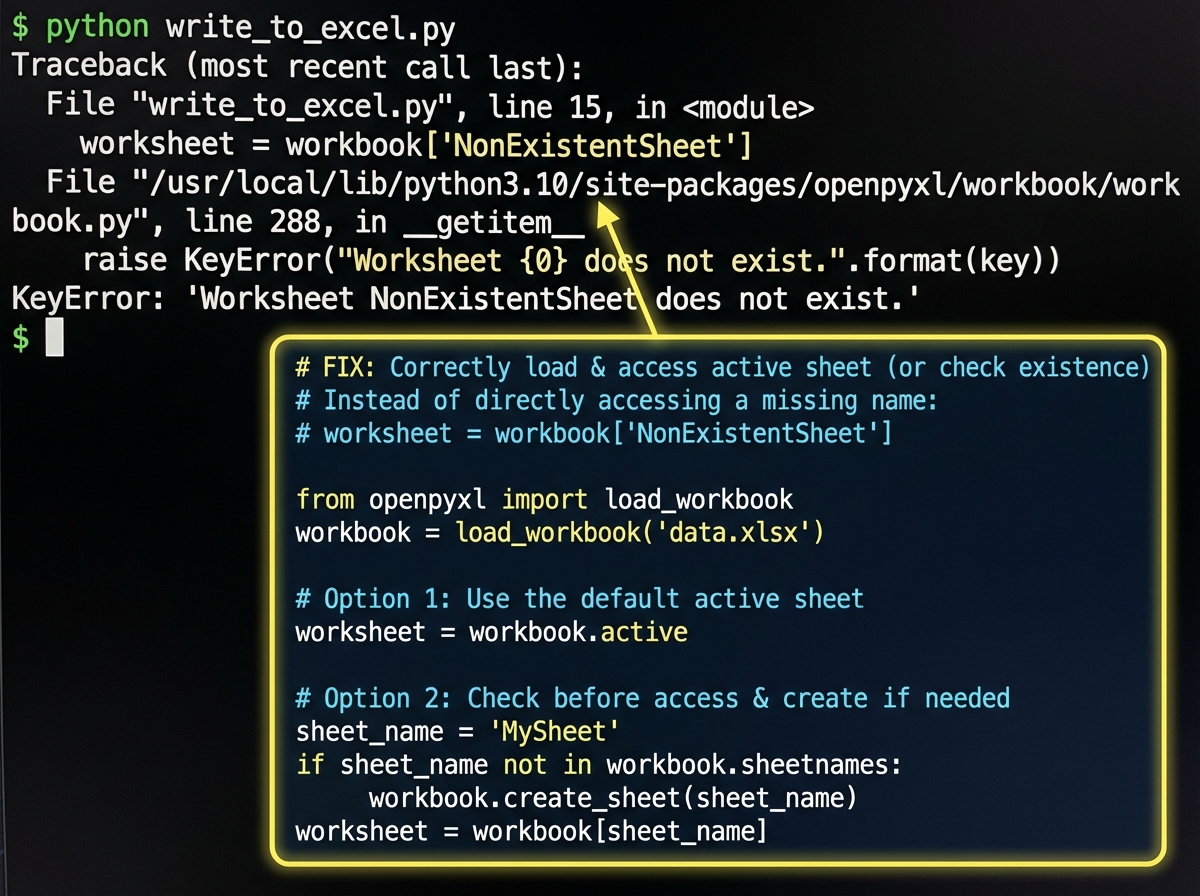
This is where most integration tutorials fall apart. They show you how to write a new Excel file. What they don’t show you is how to write back into an existing one — preserving the formatting, the formulas in cells you didn’t touch, the named ranges your stakeholders rely on.
OpenPyXL’s load_workbook() function is the key. You load the existing file, navigate to the right sheet and cells, inject your data, and save. The styles stay intact. The formulas in untouched cells stay intact. The chart that references column D still works because you wrote into column D, not a new column you named differently.
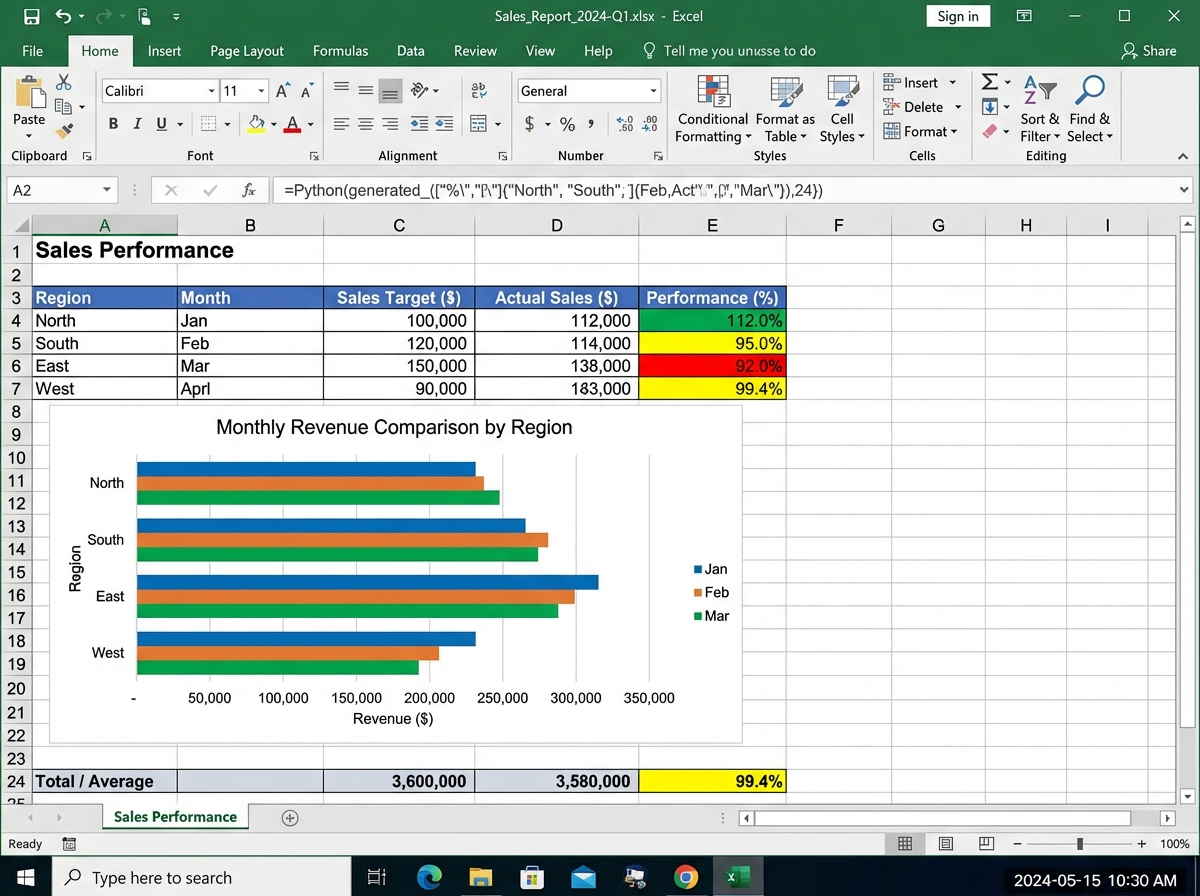
XlsxWriter takes a different approach: it’s for generating polished reports from scratch. When you need conditional formatting applied across a 50,000-row sheet with a chart embedded in the same file, XlsxWriter produces output that looks like a professional analyst built it manually. The automating monthly sales report project is the concrete proof — same data every month, same format every month, zero manual effort after the script is written.
For analysts who want to see how Python-first thinking applies beyond spreadsheets, learning Python fundamentals from scratch builds the same core muscle in a more structured environment.
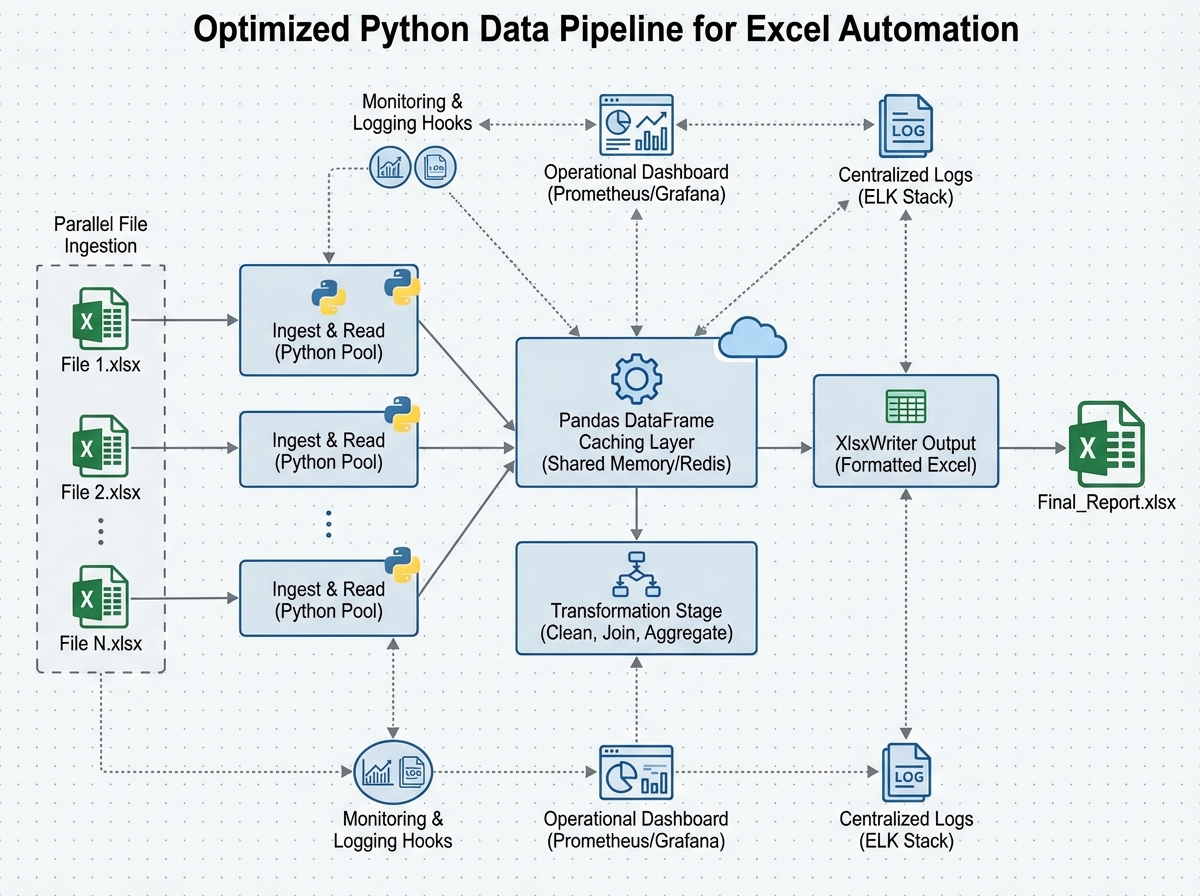
Optimizing Data Workflows So They Actually Scale
A script that processes 500 rows in two seconds will process 500,000 rows in… not 2,000 seconds, if you write it correctly. Most beginner automation code doesn’t. It reads entire files into memory when it only needs three columns. It applies transformations row by row when vectorized operations could handle the whole DataFrame at once. It recalculates from scratch every run when caching the intermediate result would take three seconds total.
Data caching means saving intermediate processed results — not re-reading and re-cleaning your source Excel files on every run. If your raw data only changes daily but your report runs hourly, cache the cleaned DataFrame as a parquet file after the first run and reload it until the source changes. Parallel processing, using Python’s concurrent.futures or multiprocessing, matters when you’re processing dozens of Excel files simultaneously — a common pattern in finance and operations teams handling regional data.
Monitoring and logging aren’t glamorous, but they’re what separates a script you trust from one you babysit. A pipeline that runs silently and fails silently is worse than a manual process, because at least manual work fails visibly. Add logging. Log what file was read, how many rows were processed, what was written and where. When something breaks at 3am while a scheduled report runs, the log is the only thing that tells you what happened.
What the Netflix Project Actually Teaches You
The final project — analyzing Netflix movies and TV shows — sounds like a fun data exercise, and it is. But its real function is different. It forces you to make all the decisions yourself: which columns matter, how to handle missing data, which visualization tells the story best, how to structure the output file so a non-technical person can use it.
By this point, you know how to use every tool in the pipeline. The project tests whether you know how to think with them. Which is the actual skill that gets you hired or promoted. Anyone can follow a tutorial. Fewer people can look at a raw dataset with 8,000 rows, 12 columns, and inconsistent values across three of them, and produce a clean, formatted Excel report that answers a real business question without being told exactly how to get there.
The dataset structure itself — a mix of categorical columns (genre, type, rating), numerical columns (release year, duration), and text columns (description, cast) — mirrors exactly the kind of mixed-type business data you’ll encounter in practice. How you clean it, how you slice it with Pandas, and how you present it in Excel is the entire skill set in one project.
What to Do Right Now
Build the pipeline in your head before writing a line of code. Sketch on paper: what goes in, what transformation happens, what comes out. Scripts written without this take three times as long to debug.
Use pd.read_excel() on a real file you already own. Not a toy dataset. A file from your actual job or life. The messiness of real data teaches you more in one session than a clean tutorial dataset teaches in five.
Learn openpyxl.load_workbook() before Workbook(). Modifying existing files is the more common real-world task. Starting with creation gives you a false sense of how the library works in practice.
Practice writing a formatted report with XlsxWriter using fake monthly sales data. Hard-code the data first, get the formatting right, then swap in the Pandas DataFrame. Separating the formatting problem from the data problem makes both easier.
Add a logging call every time your script reads or writes a file. logging.info(f"Read {len(df)} rows from {filepath}") — one line. It will save you hours of confusion the first time a script fails on a file that wasn’t where you expected it.
Implement at least one pipeline with caching. Save a cleaned DataFrame to .pkl or .parquet, check the file’s modification time against the source on each run, reload the cache if nothing changed. This pattern appears in almost every production data workflow.
Build a real project for someone who doesn’t know Python. A colleague, a family member, anyone. The requirement to make the output usable by a non-technical person forces you to think about what Excel formatting actually communicates — which is where data visualization for business audiences becomes a real skill, not just a technical exercise.
Automate something you currently do manually every week. Not a fake project. Your actual recurring task. The motivation to debug edge cases is completely different when the reward is hours of your own time back.
Leave a Reply