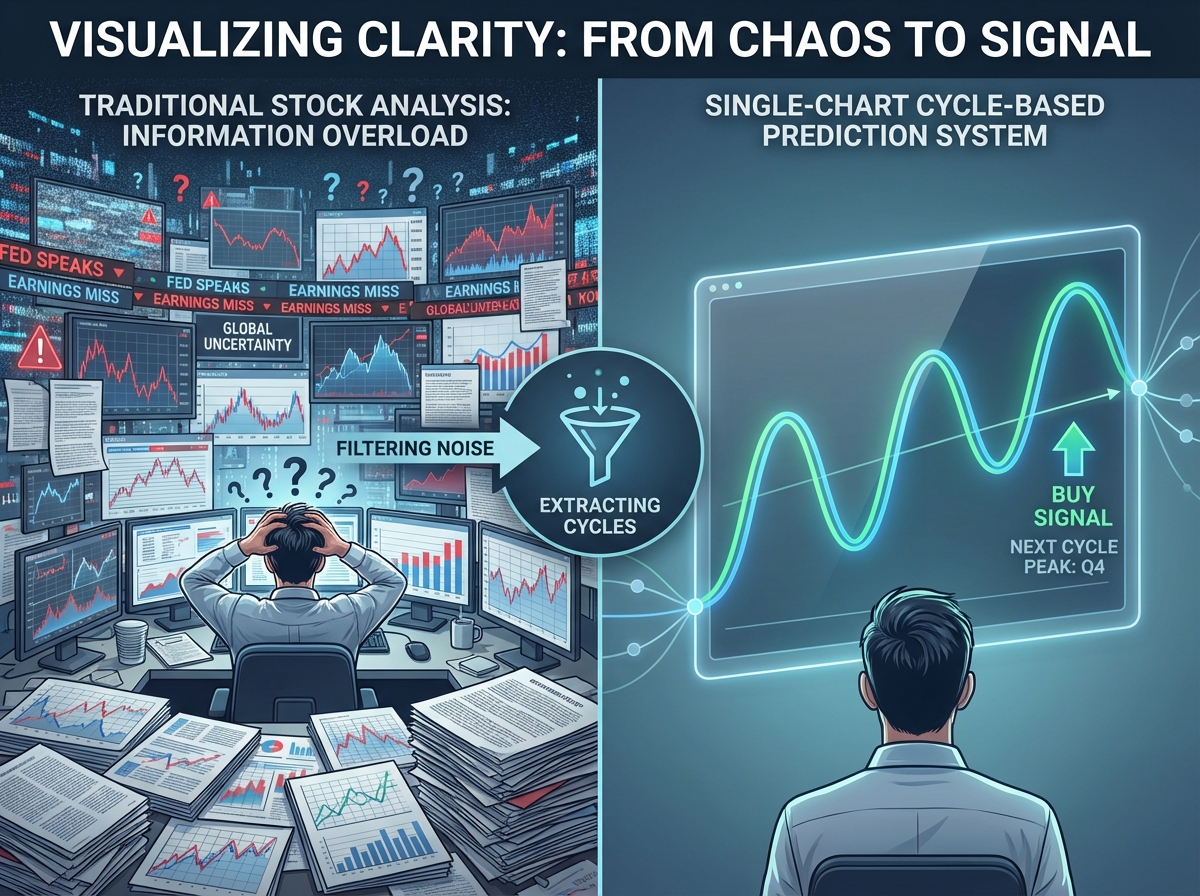
The first time I tried to figure out where the stock market was heading, I did what everyone does — I read analyst reports, watched financial news, and tried to decode what the Fed was signaling. I ended up more confused than when I started, and my portfolio showed it.
If you’re looking to learn stock market prediction, the honest answer is that most of what you’ve been told about how markets work is making it harder, not easier. The conventional approach — tracking economic data, listening to analysts, trying to interpret central bank policy — is the longest possible route to the worst possible outcome. A simpler, cycle-based method, back-tested to 1982, has consistently outperformed over 70% of professional fund managers using nothing more than a single chart checked once a week.
- Works best for people who want a rules-based system, not gut-feel trading — emotion is the enemy here
- Requires roughly 10 minutes per week and averages 0.6 trades per year — less activity, not more
- The goal isn’t to predict every wiggle in the market — it’s to catch the big bull runs and avoid the bear markets that destroy decades of savings
What “Predicting the Stock Market” Actually Means
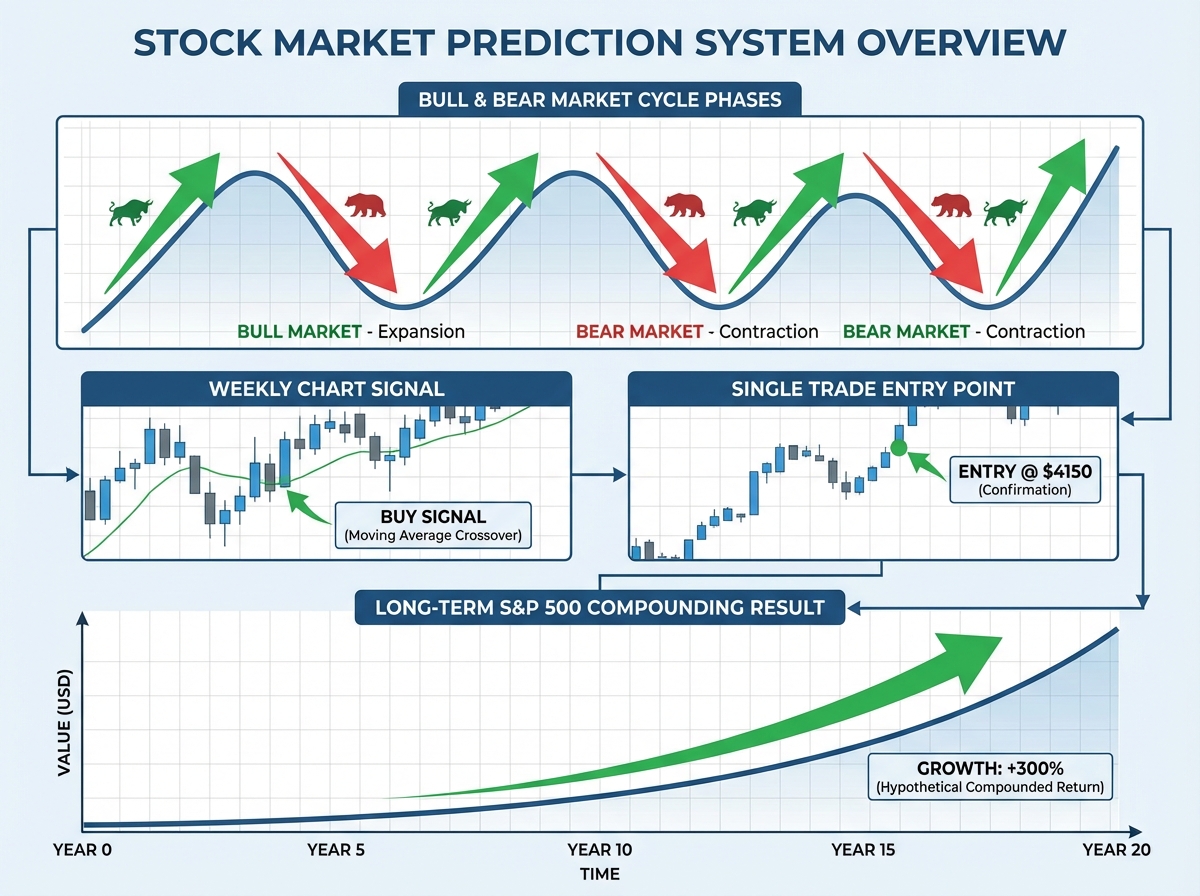
Most people hear “stock market prediction” and picture someone calling the exact top or bottom of a move. That’s not what this is, and anyone promising that is selling fantasy. What genuine market prediction looks like is identifying the dominant trend — bull or bear — with enough advance warning to position yourself on the right side of it before the big move happens.
The tools that make this possible aren’t complicated. They’re based on market cycles — the recurring patterns of expansion and contraction that have repeated throughout market history. When you learn to read those cycles, you stop reacting to news and start anticipating structure.
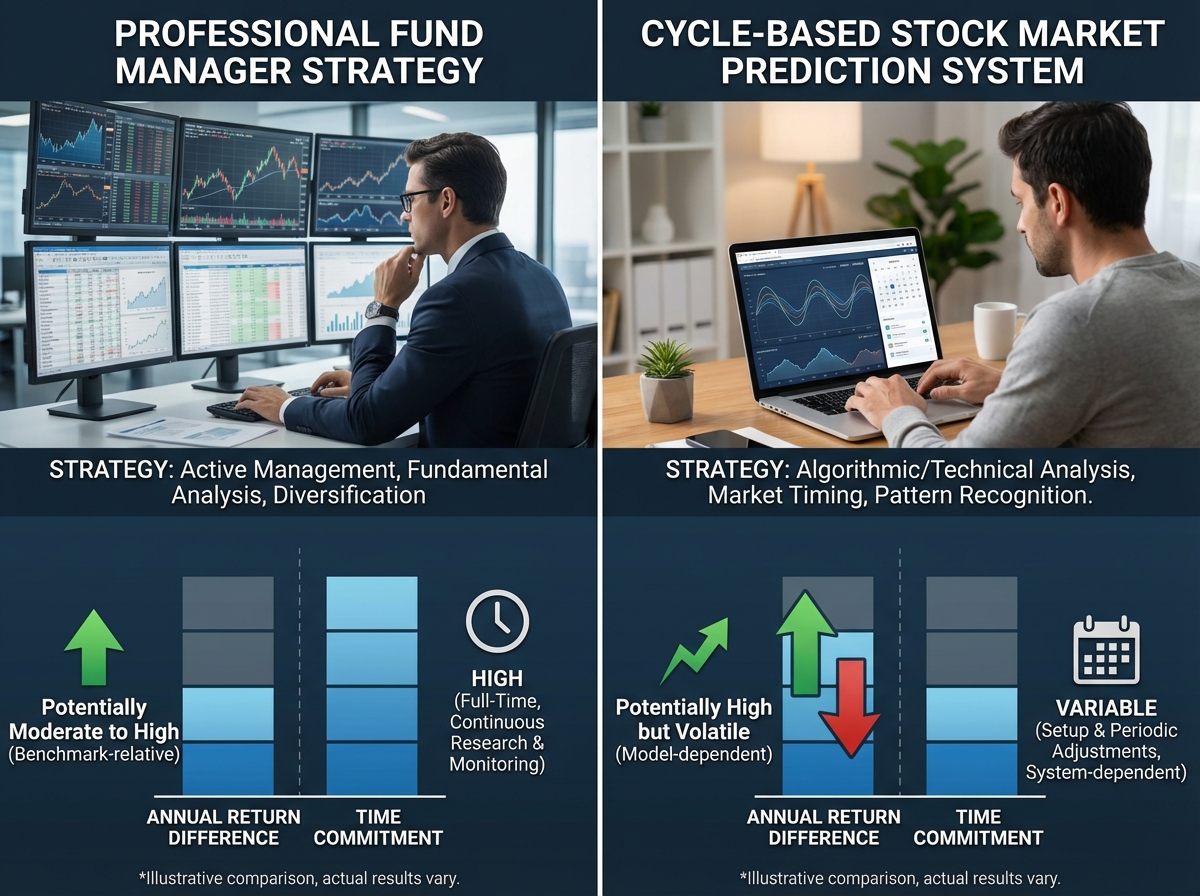
| Approach | What It Requires | Average Annual Return | Time Per Week |
|---|---|---|---|
| Professional fund manager | Full-time analysis, fees | ~5% (typical advice) | N/A — you pay them |
| Index investing (S&P 500) | Nothing | ~7–10% long-term | Minutes |
| Cycle-based timing system | Weekly chart check | Up to 5x fund manager | ~10 minutes |
Three things that surprised me most when I stopped listening to financial “experts”:
- The chart already contains everything the economic data will eventually confirm
- Trading less than once a year can outperform someone trading every day
- Being early to a bull market matters far more than being precise at the top
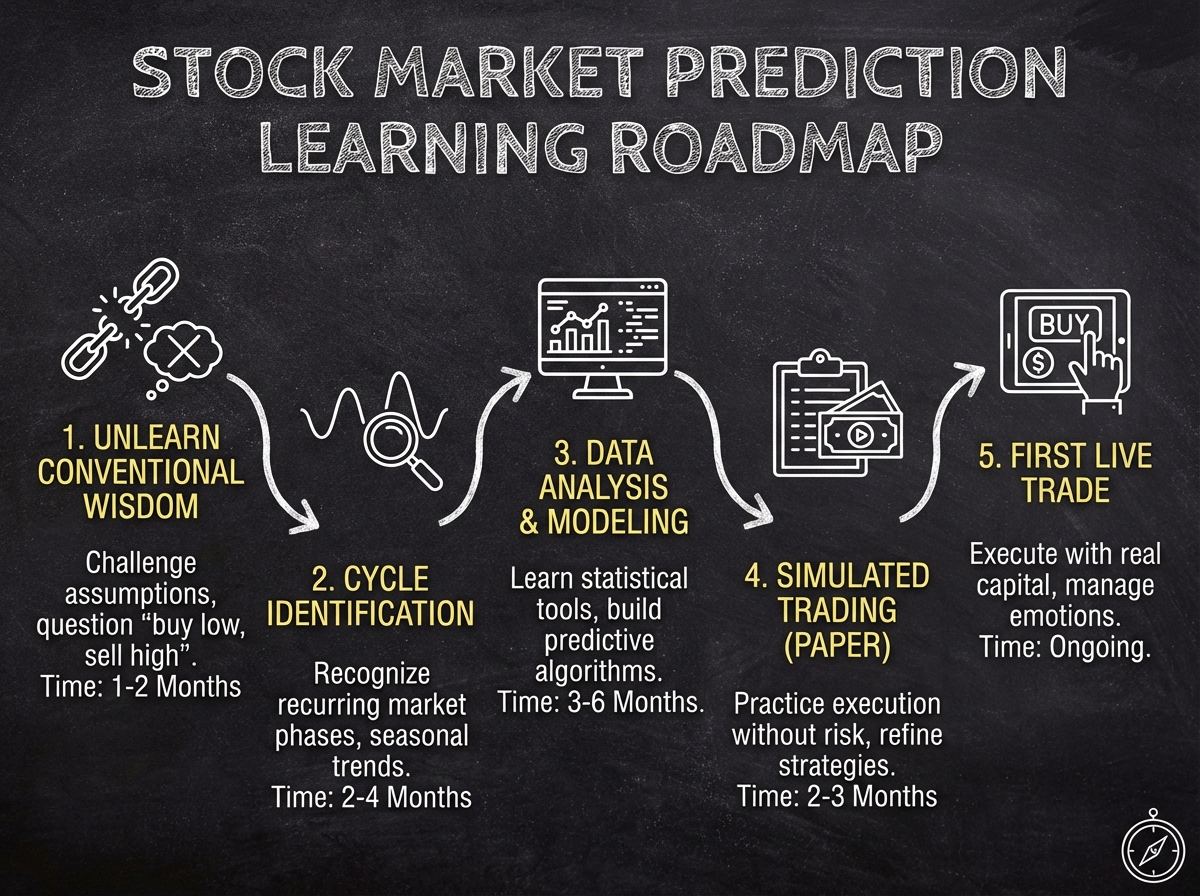
How Long It Takes to Actually Get This
| Stage | Content | Time |
|---|---|---|
| Deprogramming conventional wisdom | Understanding why expert consensus fails | 1–2 hours |
| Learning the chart tools | Reading the primary indicator and signal system | 2–3 hours |
| Understanding cycles and super cycles | Identifying where the market sits in a longer pattern | 2–4 hours |
| Back-testing the system | Verifying the logic against historical data since 1982 | 2–3 hours |
| First live application | Checking the chart, identifying current conditions | 1 hour |
| Total | 8–13 hours |
The order you learn this in matters more than how fast you go through it — trying to jump to the trading signals before you’ve understood why the cycles work leads to misreading the chart entirely. And if it takes you longer than two weeks to feel comfortable, that’s normal; you’re unlearning a lot of noise before the signal gets clear.
Why Everything You’ve Heard About Market Timing Is Wrong
“Nobody can time the market” is probably the most repeated — and most self-serving — line in financial advice. It’s repeated by the same professionals whose fees you pay regardless of whether they beat the index. The empirical data tells a different story: over 70% of active fund managers fail to outperform the S&P 500 over a ten-year period. That’s not a controversial claim — it’s well-documented in performance data going back decades.
The reason the myth persists isn’t because market timing is impossible. It’s because the methods most people use to attempt it — macro analysis, earnings forecasts, sentiment surveys — are genuinely unreliable. They’re trying to predict the cause rather than read the effect. The market’s price action already reflects all of that information in aggregate. When you understand that, the chart stops being a picture of past prices and starts being a real-time summary of everything the market collectively knows.
The single biggest mistake people make when learning stock market prediction is adding more inputs. More indicators, more news sources, more economic reports. They think complexity equals accuracy. What actually happens is that competing signals cancel each other out and you end up paralyzed at the exact moment you should be acting. The system that works is the one you can apply without hesitation at 8pm on a Sunday with no emotional charge attached to the outcome.
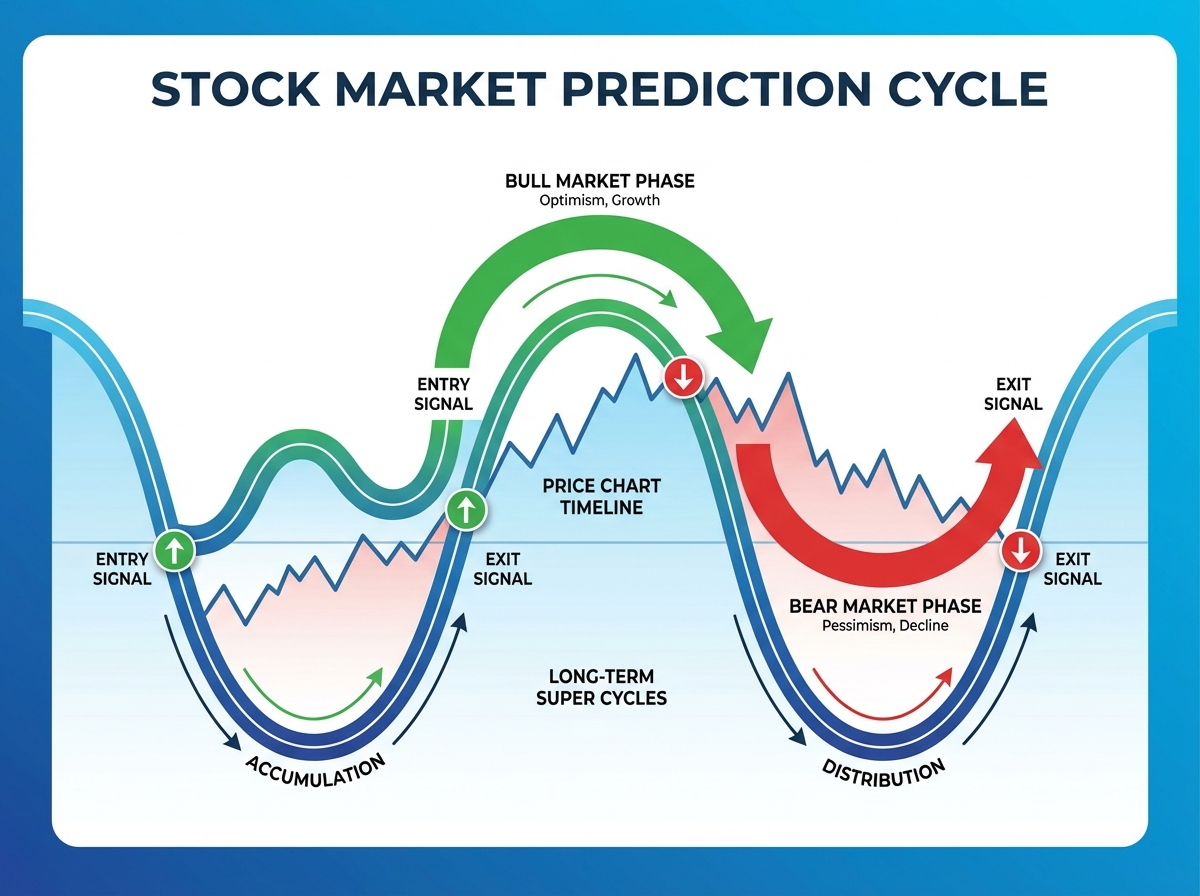
The Cycles That Actually Drive Market Direction
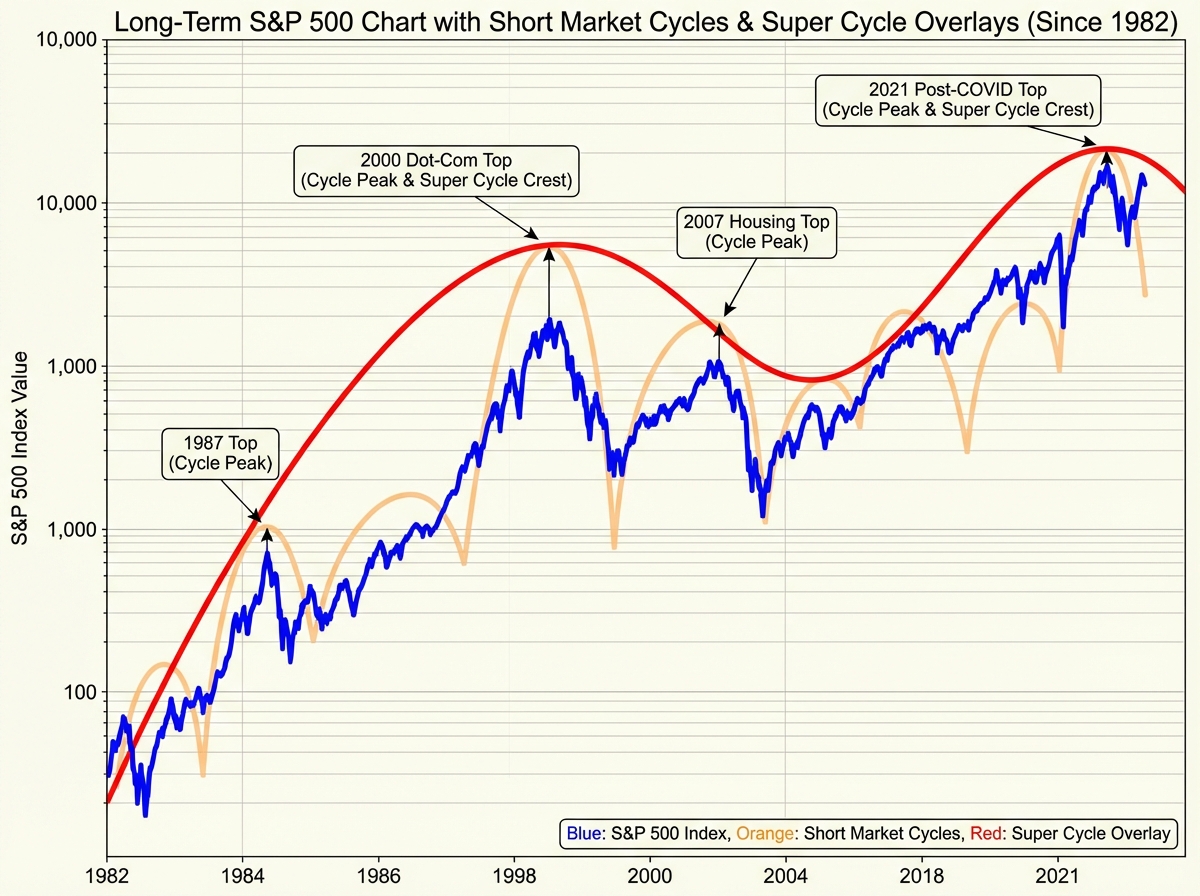
Once you stop reacting to news and start looking at structure, you start noticing that markets move in patterns that repeat across decades. There are short cycles — roughly 4-year rhythms tied to economic expansion and contraction. And there are longer super cycles that overlay those shorter moves, creating the generational bull markets and bear markets that define entire investing lifetimes.
The first time you overlay these cycles on a long-term chart and see how consistently the turning points align with the major market tops and bottoms, it’s genuinely disorienting. Not because it’s complicated — it’s remarkably simple — but because you realize how much analytical noise you were carrying around that was completely irrelevant to predicting market direction.
Aligning a trade with both the short cycle and the super cycle direction is where the edge lives. Trading with the super cycle behind you means your mistakes are survivable. Trading against it — which is what most people do when they buy into a bear market rally because the news sounds optimistic — is where portfolios get cut in half.
Reading the Chart: What You’re Actually Looking For
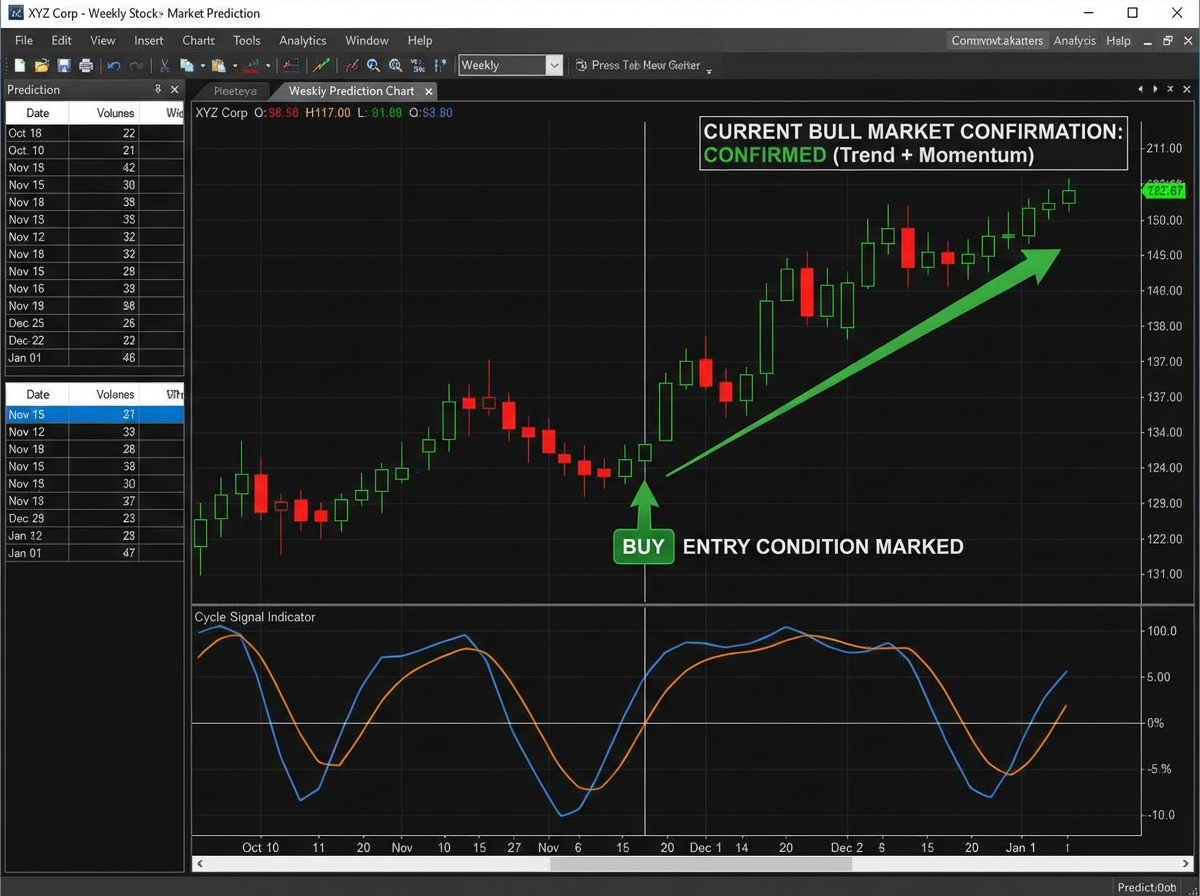
The chart used in this system isn’t a complex technical setup with dozens of overlapping indicators. It’s a basic price chart with a small number of components that tell you whether the current environment favors buying, holding, or being out of the market entirely.
What threw me off initially was expecting something more sophisticated. I kept looking for the hidden layer, the proprietary formula that would feel like real analysis. What I found instead was that the signal is obvious in retrospect on every major market cycle going back to the beginning of reliable charting data. The difficulty isn’t reading the chart — it’s trusting what you’re seeing when everything in the financial media is telling you the opposite.
The weekly check-in is what keeps this system functional. You’re not reacting to daily price swings. You’re not watching tickers. You’re answering one question: has the signal changed? If it hasn’t, you do nothing. If it has, you have one action to take. That simplicity isn’t a limitation of the system — it’s the entire point of it.
The Single Trade That Does the Heavy Lifting
Averaging 0.6 trades per year sounds like a typo when you first hear it. In a culture that equates activity with effort and effort with results, the idea that your annual investment strategy might involve fewer decisions than your monthly grocery list feels wrong. It isn’t.
The math is straightforward once you accept it. The difference between the return of a major bull market and the loss of a major bear market is enormous. If you can capture most of the upside and miss most of the downside — even imperfectly — you beat nearly every active strategy over a long enough time horizon. The one trade is an index-based position in a single stock, held through the bull phase and exited when the cycle signals a turn. No diversification headaches. No quarterly rebalancing. No watching twelve positions simultaneously.
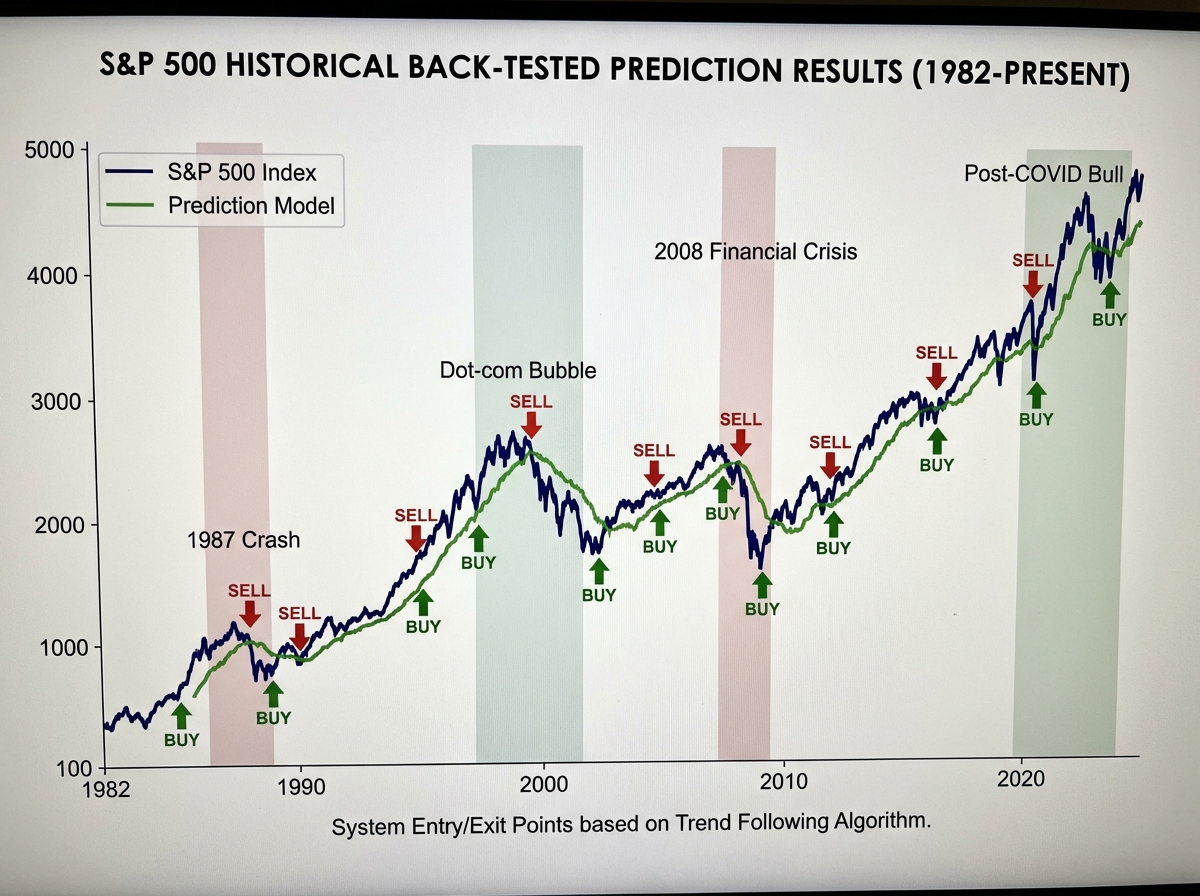
Back-tested from 1982 to the present, the system produces results that average five times the return of a typical professionally managed fund. That’s not a claim designed to impress you — it’s the consequence of a few very large correct calls compounding over decades while avoiding the bear markets that reset everyone else’s progress.
When the Market Doesn’t Follow the Script
No system works perfectly every single time, and this one doesn’t claim to. What separates a rules-based approach from guessing is how you handle the exceptions. There will be cycles that run shorter than expected. There will be signals that look clean and then reverse. The question is whether your response to those moments is defined in advance or improvised under pressure.
The system accounts for this by making the unit of measurement a weekly chart, not a daily one. Daily noise is filtered out by design. A signal that appears and then reverses within a single week doesn’t trigger a trade because the weekly close hasn’t confirmed it. This seems like a small technical detail until you realize how many bad trades it prevents — the whipsaw entries that feel obvious on a 15-minute chart and look like obvious mistakes on the weekly.
Back-testing is what gives you the psychological foundation to stay with the system when it feels uncomfortable in real time. When you’ve seen how the signal has played out across 40+ years of data — through crashes, recoveries, recessions, bubbles — the current moment loses its power to make you second-guess yourself. You’re not trading on hope. You’re trading on pattern recognition.
What Changes When You Actually Apply This
The most significant shift isn’t in your portfolio — it’s in your relationship to financial news. Once you understand that the chart reflects everything the news will eventually confirm, the noise stops feeling like signal. You stop watching market commentary for information and start watching it the way you watch weather reports: occasionally useful context, never the basis for a decision.
The retirement math reframes completely too. The conventional advice — plan on 5% a year, stay invested through everything, don’t try to time the market — is designed for a system that makes money on your fees whether markets go up or down. A system that compounds at five times that rate, even conservatively applied, means the timeline to financial independence shortens by a decade or more. That’s not a minor optimization. That’s a different life.
What to Do With This Starting Today
- Pull up a long-term weekly S&P 500 chart and find the last two major bear markets. Identify where prices were a year before each bottom — you’re training your eye to see momentum before it’s obvious.
- Stop reading financial news for one week. Notice what your decision-making process loses — almost nothing useful — and what it gains in clarity.
- Learn to identify the current cycle phase before making any trade. Entering without knowing whether you’re in a bull or bear cycle environment is the only mistake that can’t be recovered from quickly.
- Back-test any system you use on at least 20 years of data before trusting it with real money. One bull market cycle of good results is luck. Four decades of consistent signals is structure.
- Define your exit before you enter. The signal that gets you out should be as clearly defined as the one that gets you in — know it before the trade, not during it.
- Use a single broad-market instrument rather than individual stocks. Removing company-specific risk from a macro timing strategy eliminates the most unpredictable variable in the system.
- Check your chart once a week, on the same day, at the same time. Consistency in observation prevents the selective attention that makes you see signals that confirm what you already want to do.
- Track your trades in a log with the signal condition at entry and exit. Over time, the log shows you where your own psychology is adding noise to a clean system — that feedback is more valuable than any single return.
Leave a Reply