The first time I placed a swing trade, I had no idea what I was actually doing. I saw a candle close above a level, I entered, and I watched the price immediately reverse and take out my stop. I told myself it was bad luck. It wasn’t. It was a complete absence of understanding — of why price moves, who moves it, and when.
If you’re looking to learn swing trading, the honest answer is that the strategy itself is only a small piece of what makes it work. The bigger piece is developing a mental model of how markets are actually structured — how institutions deliver price, where liquidity sits, and how to read a chart not as a random series of candles but as a deliberate sequence of moves. That understanding is what separates trades that make sense from trades that are just guesses dressed in technical language.
- Swing trading works best when you understand market structure first — entry signals without structure context are noise.
- Liquidity and fair value gaps are the two concepts that will change how you read every chart you ever look at.
- Smart money concept strategies are learnable, but only after you stop thinking in terms of indicators and start thinking in terms of price behavior.
What Swing Trading Actually Means (Not the Textbook Version)
Most definitions of swing trading focus on the holding period — a few days, maybe a week or two, capturing a “swing” in price. That’s technically accurate but practically useless. What swing trading really means, in the way it’s actually applied by traders who do it consistently, is this: you’re identifying a directional move before it happens, entering at a point of value, and riding the move until price delivers to a target. The “swing” is the distance between where institutions accumulate and where they distribute.
The reason this matters for a beginner is that if you think of swing trading as just “hold a trade for a few days,” you’ll keep entering at the wrong place and getting stopped out at the worst possible moment. Swing trading isn’t about time — it’s about position. You need to know where you are in the structure of price delivery before anything else makes sense.
The core building blocks of swing trading strategy:
- Reading OHLC candlestick data to understand who controlled price during each period
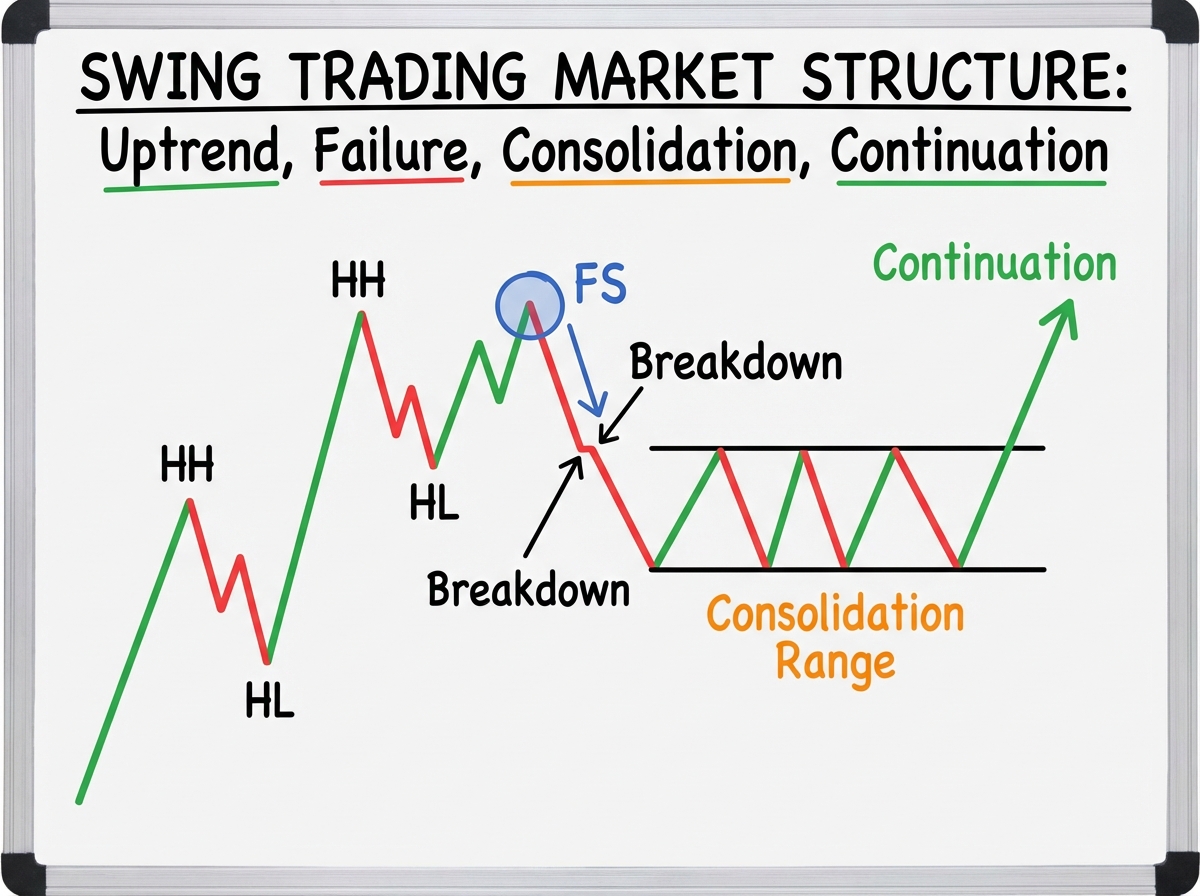
- Identifying market structure — the sequence of highs and lows that define trend direction
- Recognizing consolidation phases where price is ranging before the next directional move
- Finding liquidity zones where stop losses cluster and institutional orders get filled
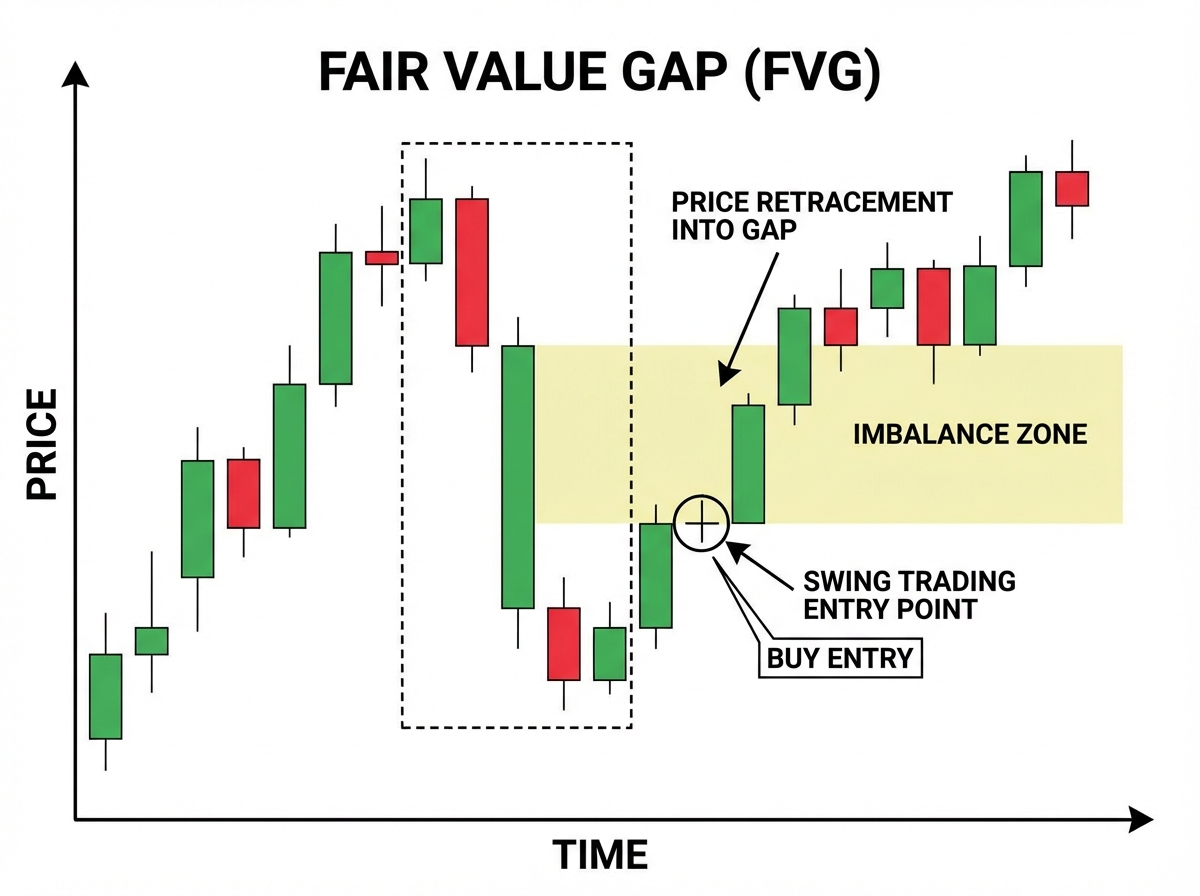
- Using fair value gaps to identify where price is likely to return before continuing
Sharp Insights
- A candle doesn’t move price — orders behind it do.
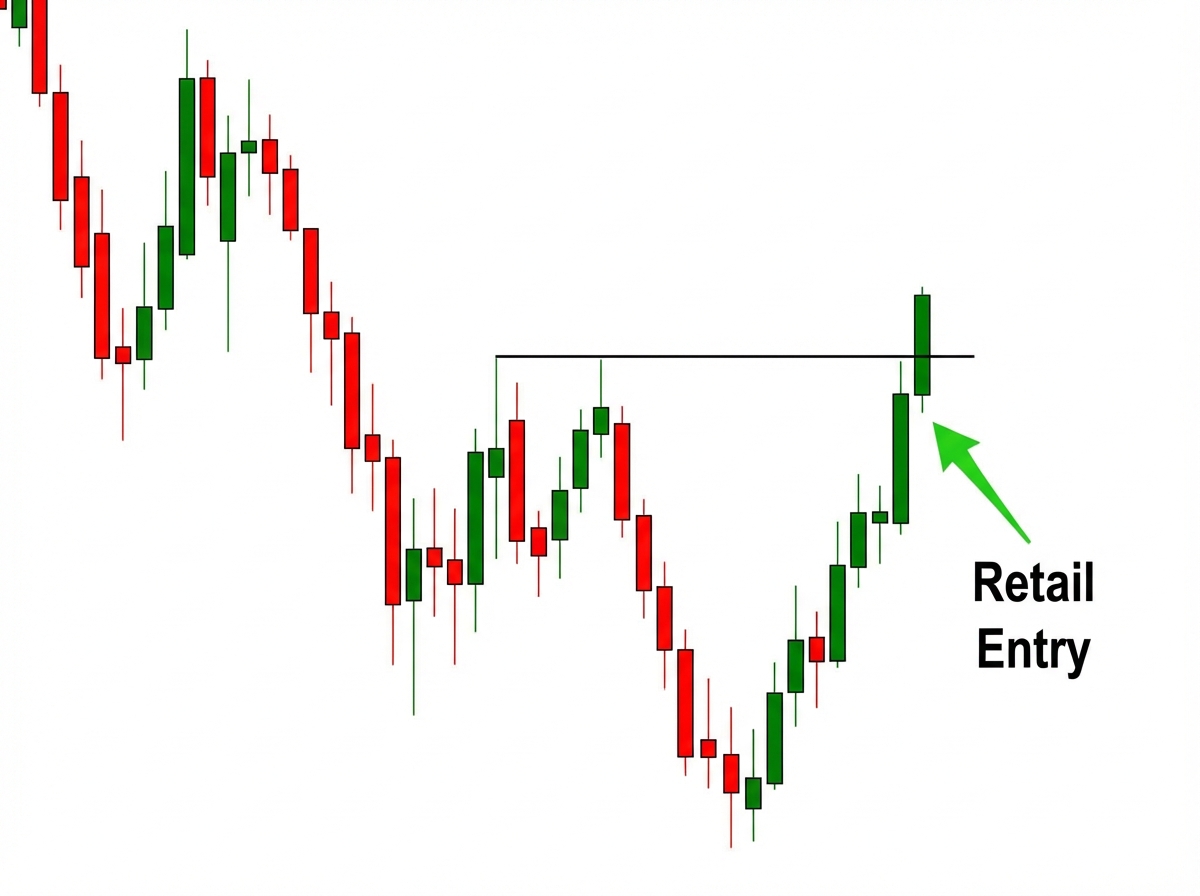
- The most dangerous place to enter a swing trade is after the breakout everyone sees.
- Ranging markets aren’t directionless — they’re loading.
How Long It Actually Takes to Trade This Way
| Stage | Content | Time |
|---|---|---|
| Foundation | Candlestick reading, OHLC structure, basic market terminology | 1–2 weeks |
| Market Structure | Identifying swing highs/lows, failure swings, consolidation phases | 2–3 weeks |
| Liquidity & FVG | Liquidity zones, fair value gaps, inefficiency recognition | 2–4 weeks |
| Algorithm Price Delivery | Institutional dealing ranges, weekly highs/lows, setup identification | 3–4 weeks |
| Execution Practice | Demo trading full setups with journal entries | Ongoing, minimum 4–6 weeks |
| Total | Full foundation to consistent demo execution | 12–19 weeks |
The order of those stages matters more than how fast you move through them — building execution skills before understanding liquidity is the single most common reason traders plateau early. And if it takes you longer than the estimate above, that’s not a sign you’re behind — it’s usually a sign you’re actually doing the repetition work instead of just watching.
Candlesticks Are a Language, Not a Pattern Checklist
Every beginner learns candlestick patterns the same wrong way: memorize the shape, look for the shape, trade the shape. Doji means reversal. Engulfing means momentum. Hammer means bounce. It takes a few months of losses to understand why this approach fails almost every time.
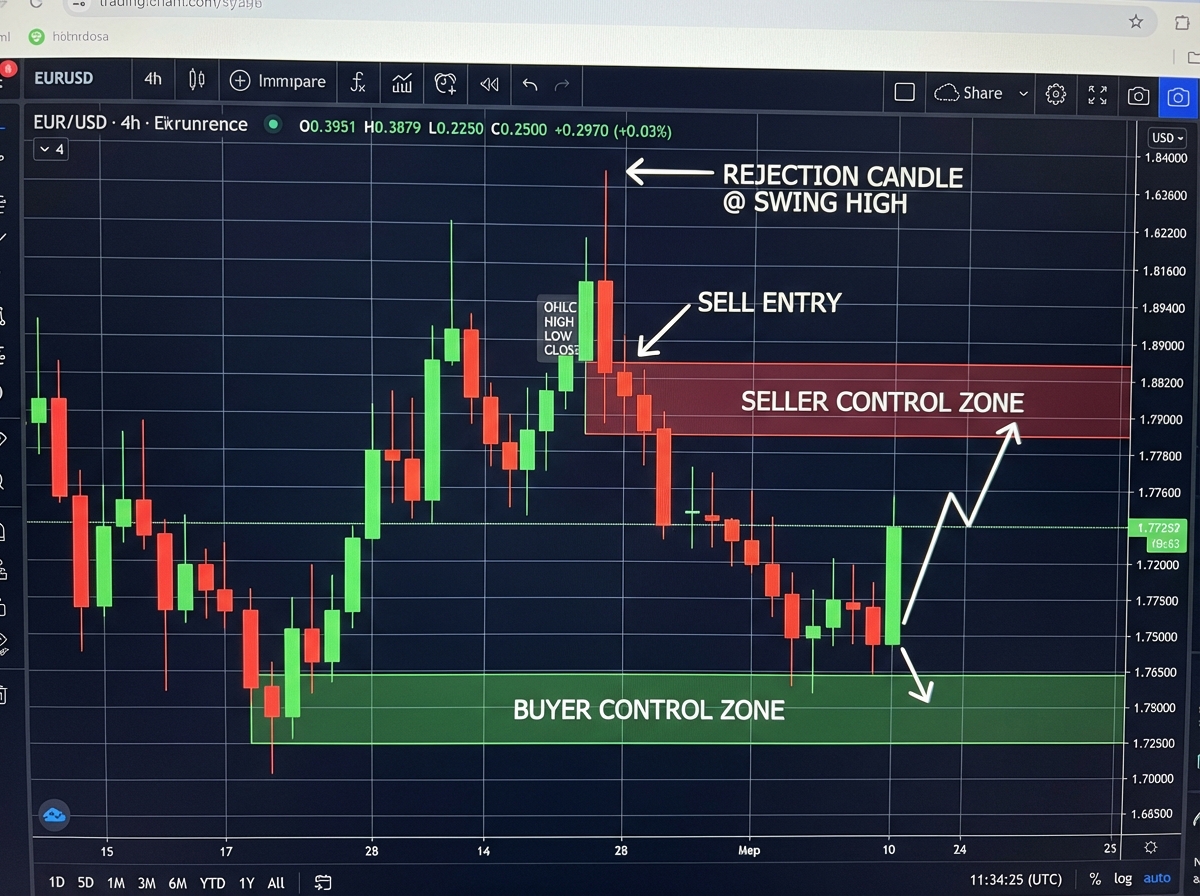
The actual value of a candlestick is in the story it tells about who was in control during that time period. An OHLC candle where price opened low, pushed high, then closed near the open tells you buyers tried and sellers rejected them. That’s information about intent, not a pattern to memorize. The same candle shape in different structural contexts means completely different things.
When you understand candlesticks as a language — specifically, as a record of the fight between buyers and sellers during a specific window of time — your chart reading changes completely. You stop looking for patterns to trigger entries and start reading sequences. A sequence of candles tells you whether buyers are gaining control, losing it, or being trapped by a fakeout. That’s what informs a swing trade, not any single candle shape.
Market Structure Is the Only Map You Actually Need
Before I understood market structure properly, I was essentially trading blindfolded. I had indicators, I had levels, I had a “system” — but I had no sense of where price was in its larger journey. Was it in the middle of a trend? Was it exhausted? Was it setting up a reversal or a continuation? I didn’t know how to read that.
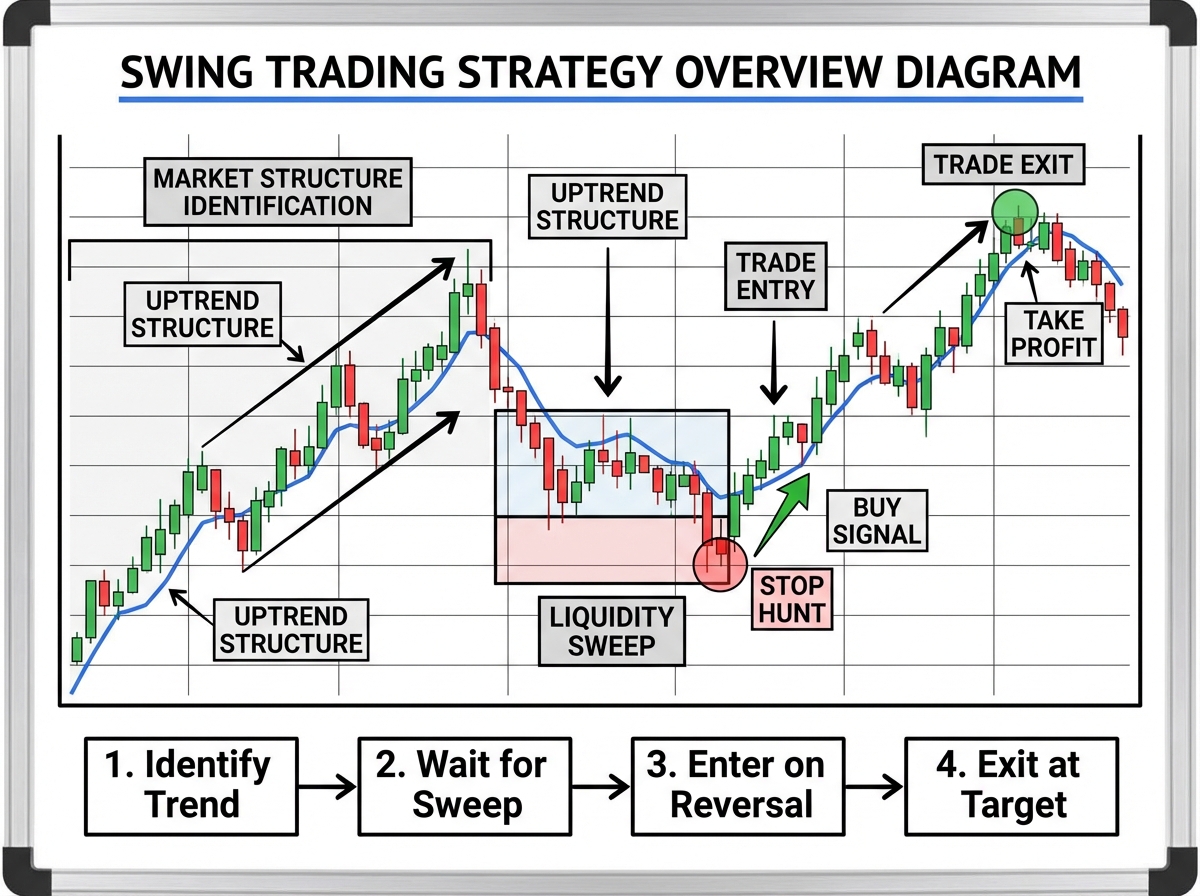
Market structure gives you that map. It’s the sequence of higher highs and higher lows in an uptrend, lower highs and lower lows in a downtrend, and the specific moments when that sequence breaks down. A failure swing — where price fails to make a new high in an uptrend — is one of the most reliable early signals that the structure is shifting. It doesn’t guarantee a reversal, but it changes the weight of evidence. You stop defaulting to “the trend is up” and start asking what the structure is actually showing.
Consolidation phases are where most beginners lose patience and make expensive mistakes. Price ranges between two levels, nothing clear happens, and after a few days of watching nothing move, you either exit a position that was about to work or you enter a trade in the middle of nowhere. What’s actually happening during a range is that price is building the order flow needed for the next directional move. The range isn’t randomness — it’s preparation. Learning to wait inside a consolidation without acting is one of the hardest skills in swing trading, and it’s almost never mentioned in beginner content.
Where Liquidity Sits and Why It Matters More Than Your Entry
The biggest mistake most people make when learning swing trading is treating their entry price as the most important variable. It isn’t. The most important variable is where you’re entering relative to liquidity — specifically, relative to where other traders have their stop losses clustered.
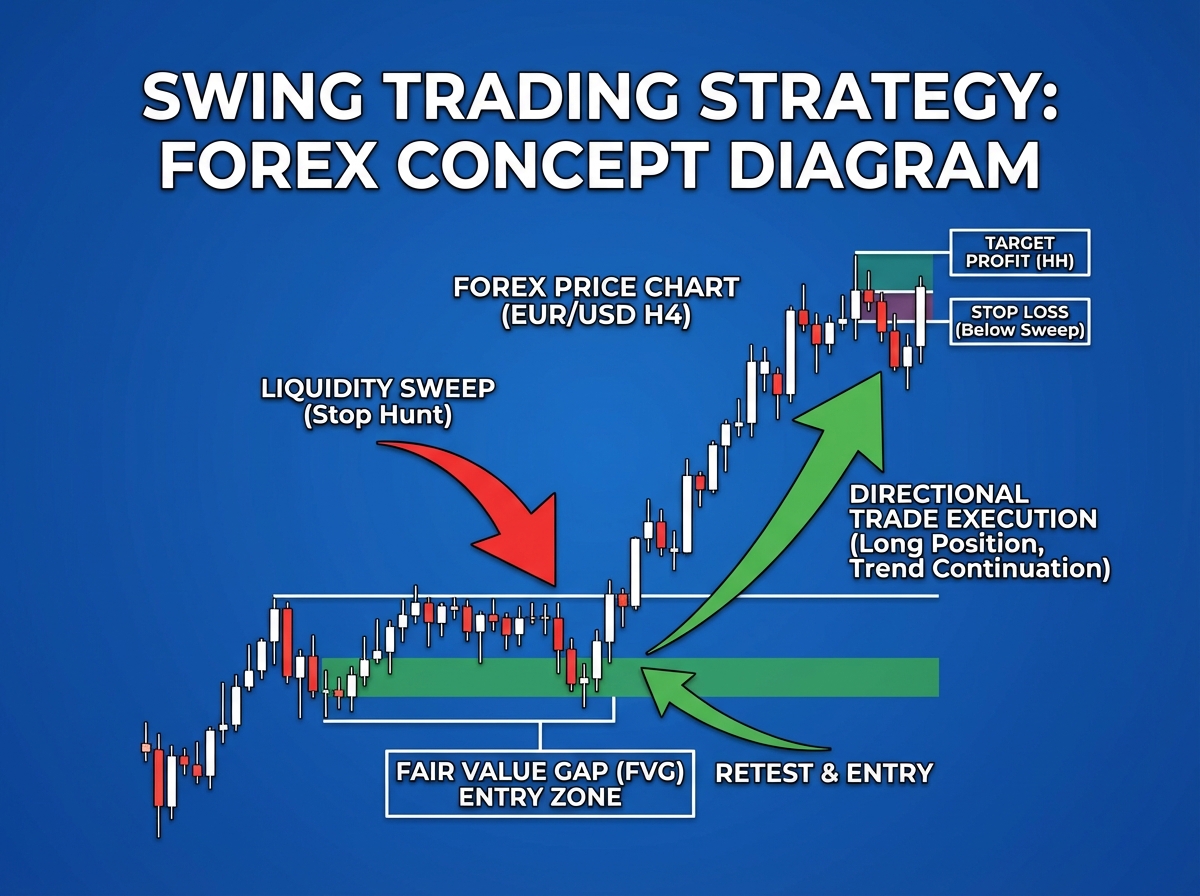
Institutional traders don’t move price arbitrarily. They need liquidity to fill their orders. Retail stop losses provide that liquidity. So when price sweeps above a previous high before reversing sharply downward, it’s not a random spike — it’s a deliberate move to collect the buy stop orders sitting above that high before price delivers in the other direction. Once you see this happen on a chart, you cannot unsee it. It changes the way you look at every “breakout” that fails immediately after.
Fair value gaps are the other side of this concept. When price moves so aggressively in one direction that it leaves an imbalance — a gap between the low of one candle and the high of a candle two positions earlier — that inefficiency tends to get filled before price continues. These gaps are where smart money swing trading setups often form: price returns to the gap, fills the imbalance, and then continues in the original direction. Trading into a fair value gap as a retracement entry is a fundamentally different approach from chasing a breakout, and the results reflect that difference.
Institutional Price Delivery and How Swing Setups Actually Form
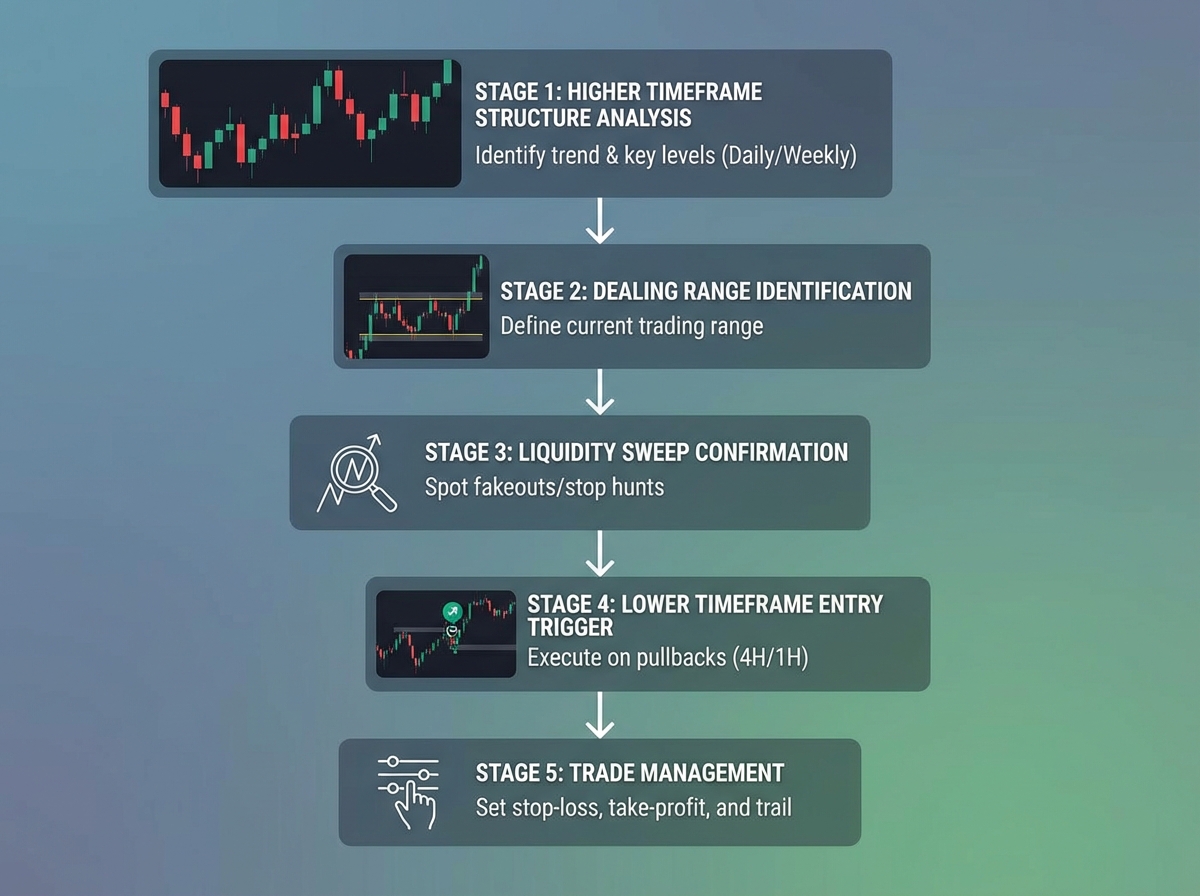
The concept of algorithmic price delivery sounds technical, but what it describes is actually straightforward: institutional order flow follows a predictable pattern of expansion, retracement, and continuation that repeats across timeframes. The dealing range — the high-to-low range in which institutional algorithms operate — defines where price is likely to seek liquidity at the extremes before delivering to the opposing extreme.
Previous week highs and lows are particularly significant in this framework. Price frequently sweeps the prior week’s high or low early in a new week before reversing and delivering the actual directional move. If you understand this, you stop entering breakouts of weekly levels and start waiting to see if the level gets swept first. That shift in timing — from entering on the break to entering after the sweep — accounts for a dramatic improvement in trade quality.
Actual swing trading execution within this framework has a specific sequence: identify the higher timeframe structure, locate the dealing range, find where liquidity has been left on one side, wait for the sweep, then enter on confirmation at a point of value — usually a fair value gap or a structural break on a lower timeframe that confirms the reversal. The entry is the last thing you figure out, not the first.
What Chart Analysis for Trade Entry Really Looks Like
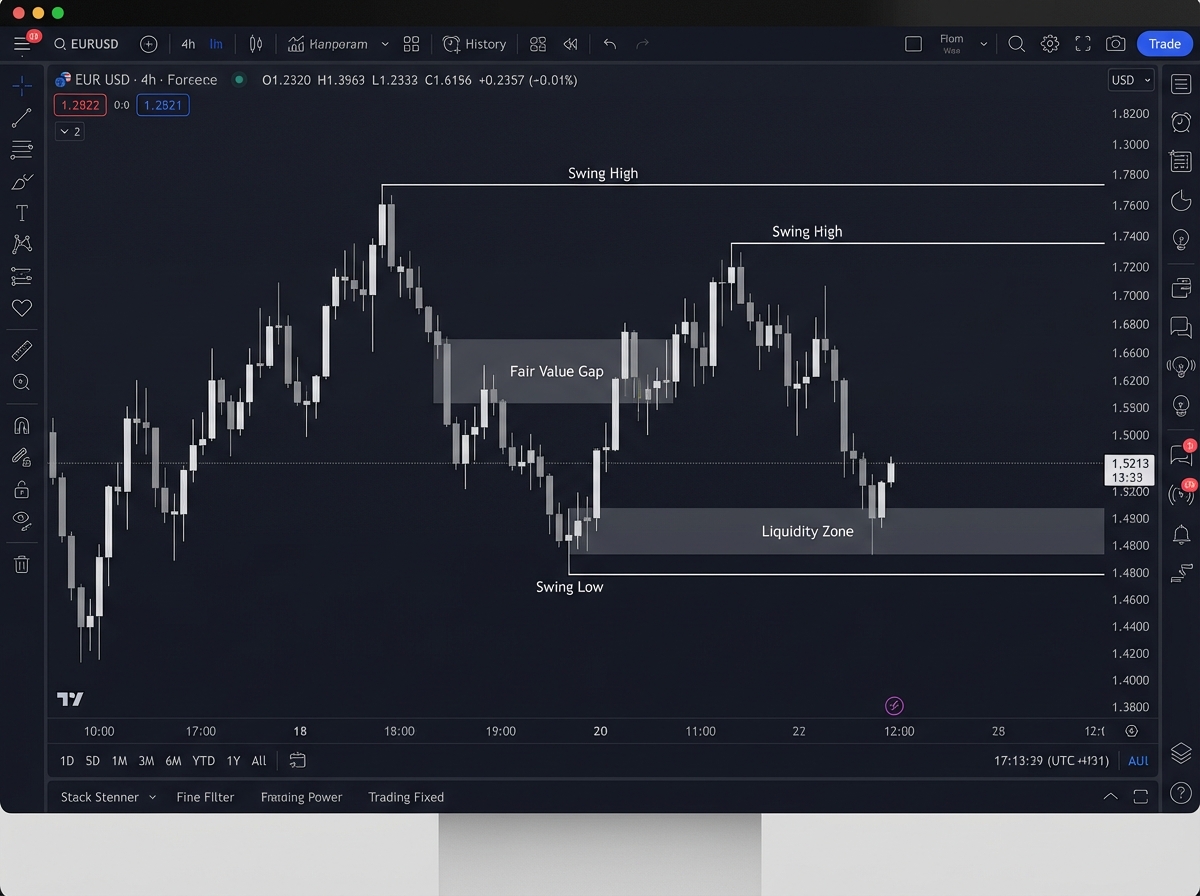
There’s a version of chart analysis that looks busy — lines everywhere, multiple indicators, colored zones across the entire chart. And there’s the version that actually precedes good swing trades, which looks almost empty by comparison. A few structural points marked. One or two liquidity zones identified. Maybe a fair value gap outlined. That’s it.
When you first start doing chart analysis for swing trade entries, the temptation is to keep adding context until you feel confident. More lines mean more information, more information means more confidence, more confidence means you can justify the trade. What actually happens is that you end up with a chart so full of levels that price can never move more than a few points without hitting something you drew, which means everything looks like a signal and you’re back to guessing.
Real chart analysis for swing trading is about elimination, not addition. You’re removing the noise until only the relevant structure remains. The question isn’t “what do I see on this chart?” — it’s “what does this chart need to show me before there’s a trade here?” That reframe — from reactive to conditional — is the actual shift that produces consistent entries.
Journaling and Demo Practice Are Where It All Gets Real
No amount of chart reading prepares you for the psychological weight of watching a trade go against you. Even on a demo account, the moment price moves toward your stop and keeps going, every flawed instinct you have kicks in. Close it now. Move the stop. Add to the position to average down. All of the things that destroy real accounts get tested in demo.
The only thing that creates discipline is a journal that forces accountability. Every trade recorded: the setup rationale, the entry, the target, the stop, and — critically — what actually happened and why the thesis was right or wrong regardless of outcome. A trade that hit its target because of luck is just as worth analyzing as one that stopped out for a legitimate reason. The journal separates process from result, which is the only way to improve in a domain where results are noisy.
Using a structured note-taking system for your trade analysis turns individual observations into patterns you can actually see over time. After forty or fifty logged trades, you start to notice things: which setups you execute well, which ones you rush, which market conditions produce your best results. That information is worth more than any strategy addition because it’s specific to you — how you see the market and where your blind spots are.
What Actually Matters When You Look Back
After going through all of this — the candlestick theory, the structure work, the liquidity framework, the execution practice — what you realize is that none of it is complicated. It was never complicated. It was just unfamiliar. The chart was always speaking a language; you just hadn’t learned it yet.
The traders who don’t make it through this learning curve aren’t less intelligent. They’re less patient. They skip the structure work and go straight to setups. They skip the demo journal and go straight to live money. They look for the shortcut that converts confusion directly into profit without the friction in between. That shortcut doesn’t exist, but the path through the friction is shorter than it looks from the beginning.
Here’s what to actually do, starting now:
- Mark swing highs and lows on every chart you study because structure is the first filter every valid swing trade must pass before you evaluate anything else.
- Draw nothing on your chart until you can identify the current market structure in one sentence — if you can’t describe it verbally, you don’t understand it well enough to trade it.
- Watch for liquidity sweeps before you enter any breakout — if a level breaks cleanly without any wick through it first, wait to see if price returns to sweep before committing.
- Identify at least one fair value gap on your entry timeframe before every trade — if there’s no imbalance nearby, there’s no clear reason for price to retrace to your entry zone.
- Track previous week highs and lows every Monday and note whether price takes one of them out early in the week before reversing — do this for eight weeks before drawing any conclusions.
- Record every demo trade with a thesis written before entry — not after — so you can compare what you thought would happen with what actually did.
- Review your journal for setup type, not just win rate — the goal is to identify which specific configurations produce your clearest reads, then repeat only those.
- When in consolidation, define your invalidation level before price reaches either boundary — knowing in advance what would change your read prevents the reactive decisions that kill swing trades inside ranges.
Leave a Reply