The first time you open a live forex chart, nothing makes sense. Candles moving in every direction, indicators stacked on top of each other, and a dozen YouTube videos telling you contradictory things about where price is “about to go.”
If you’re looking to learn forex pattern trading, the most honest answer is this: it’s a structured, repeatable approach to reading price action that uses geometric and ratio-based patterns — like the Gartley, Bat, and Cypher — to identify high-probability trade entries. Forex pattern trading works because markets are driven by human behavior, and human behavior repeats. Once you can see those repetitions on a chart, you stop guessing and start trading with a framework.
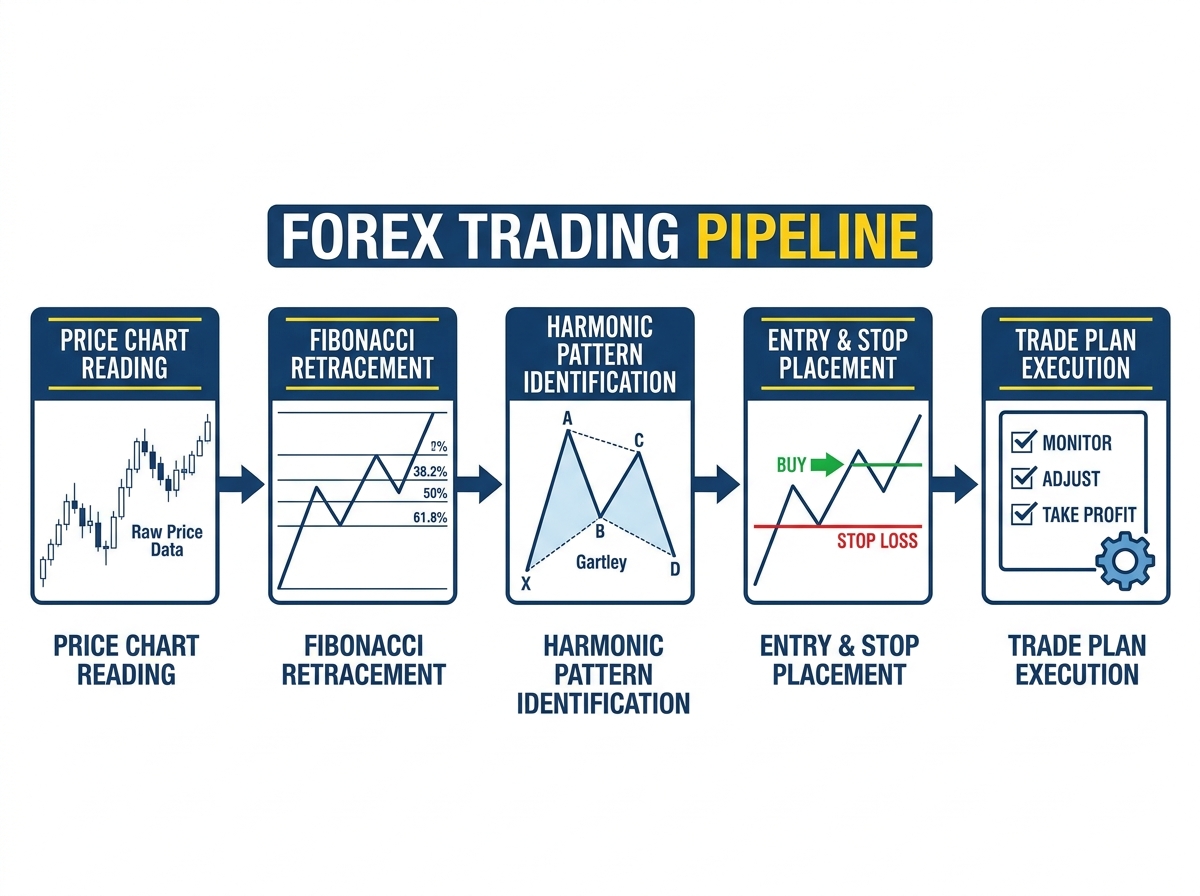
- Pattern trading only works when you can first read raw price structure — skip that foundation and every pattern you draw will be in the wrong place.
- The difference between a winning setup and a losing one is almost always about where you place your stop, not where you enter.
- Most beginners spend months on strategy and almost no time on money management — that’s exactly why they blow accounts.
What Forex Pattern Trading Actually Is
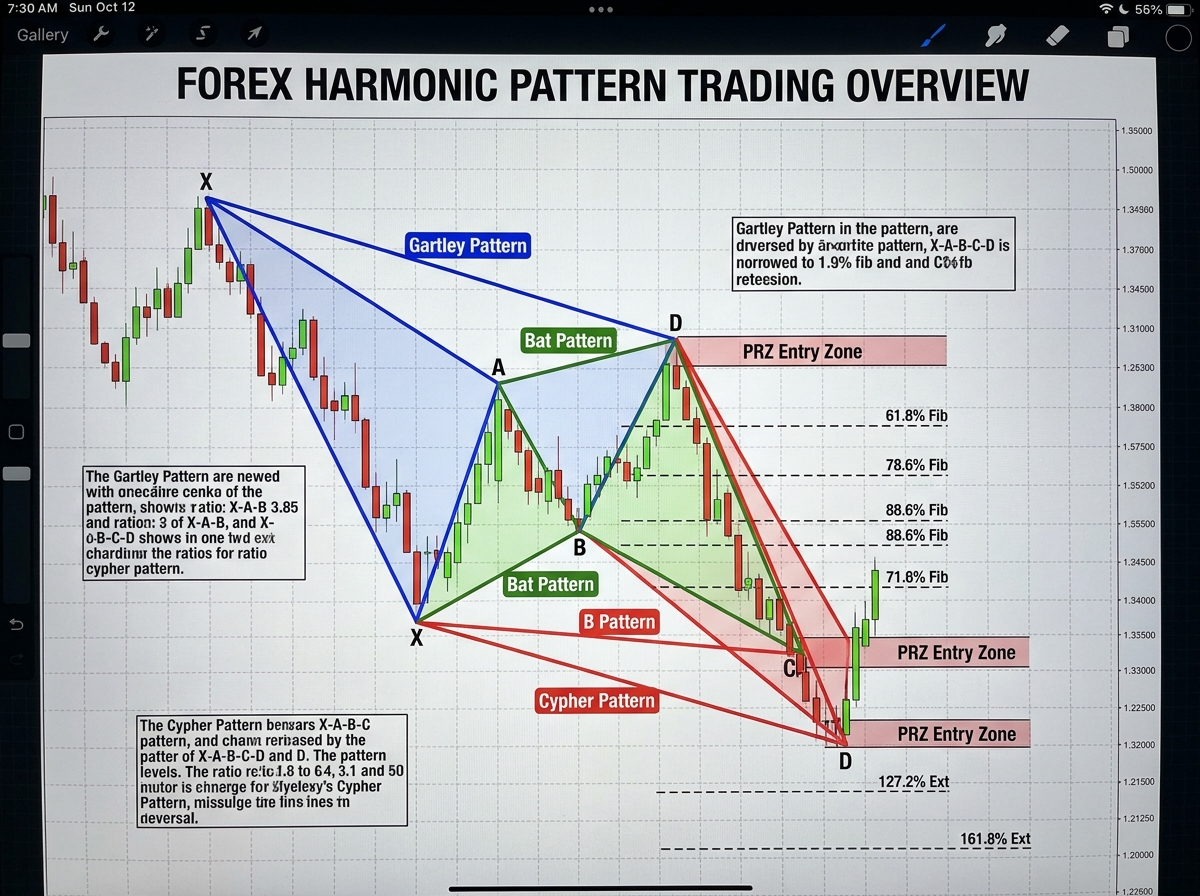
Forex pattern trading is a method of analyzing price charts using recurring geometric formations — formed by swing highs, swing lows, and Fibonacci ratios — to predict where price is likely to reverse or continue. Unlike purely indicator-based systems that lag behind price, patterns are drawn directly on price action, making them forward-looking by nature.
The core categories most traders work with:
| Pattern Type | What It Identifies | Key Ratio |
|---|---|---|
| AB=CD | Simple measured move, price projections | 1:1 leg equality |
| 2618 Trade | Double top/bottom reversal confirmation | 2.618 Fibonacci extension |
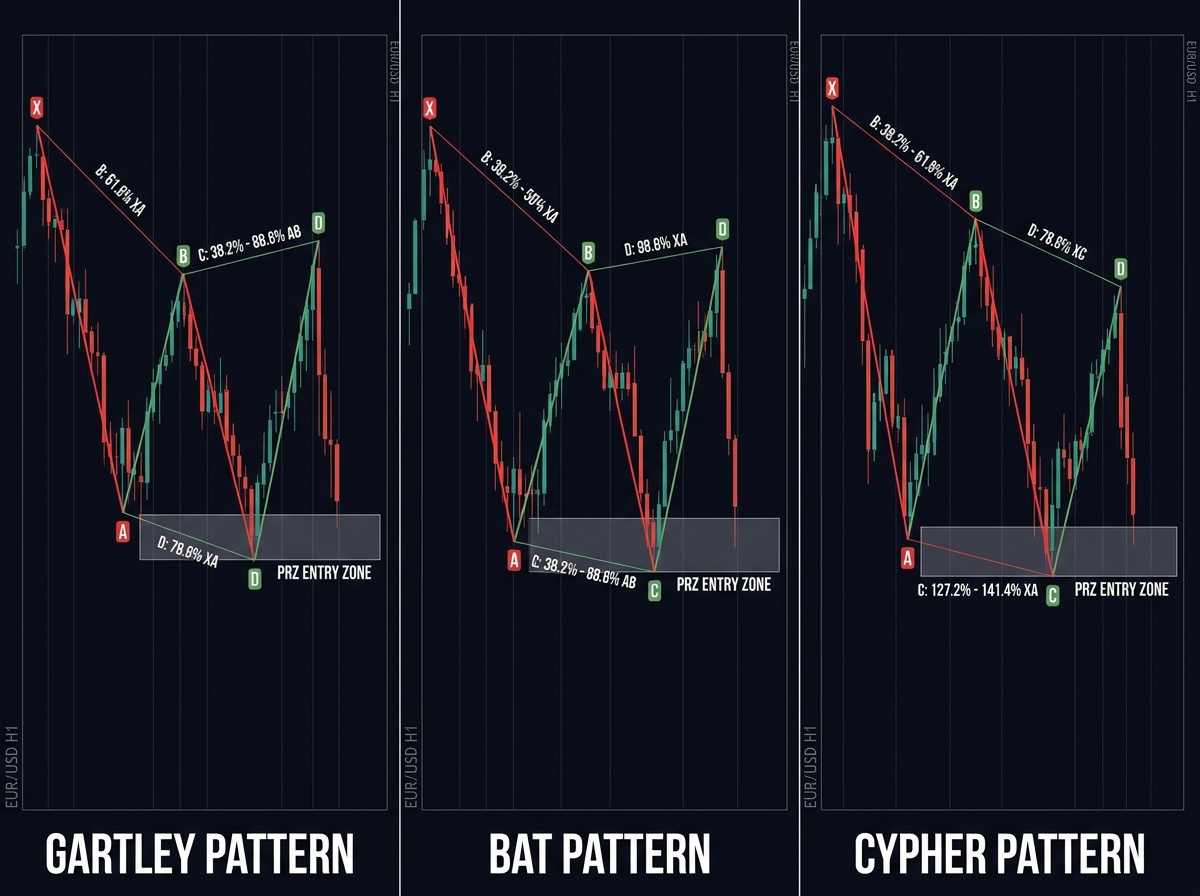
| Gartley “222” | 5-point reversal off a key retracement | 0.618 XA retracement |
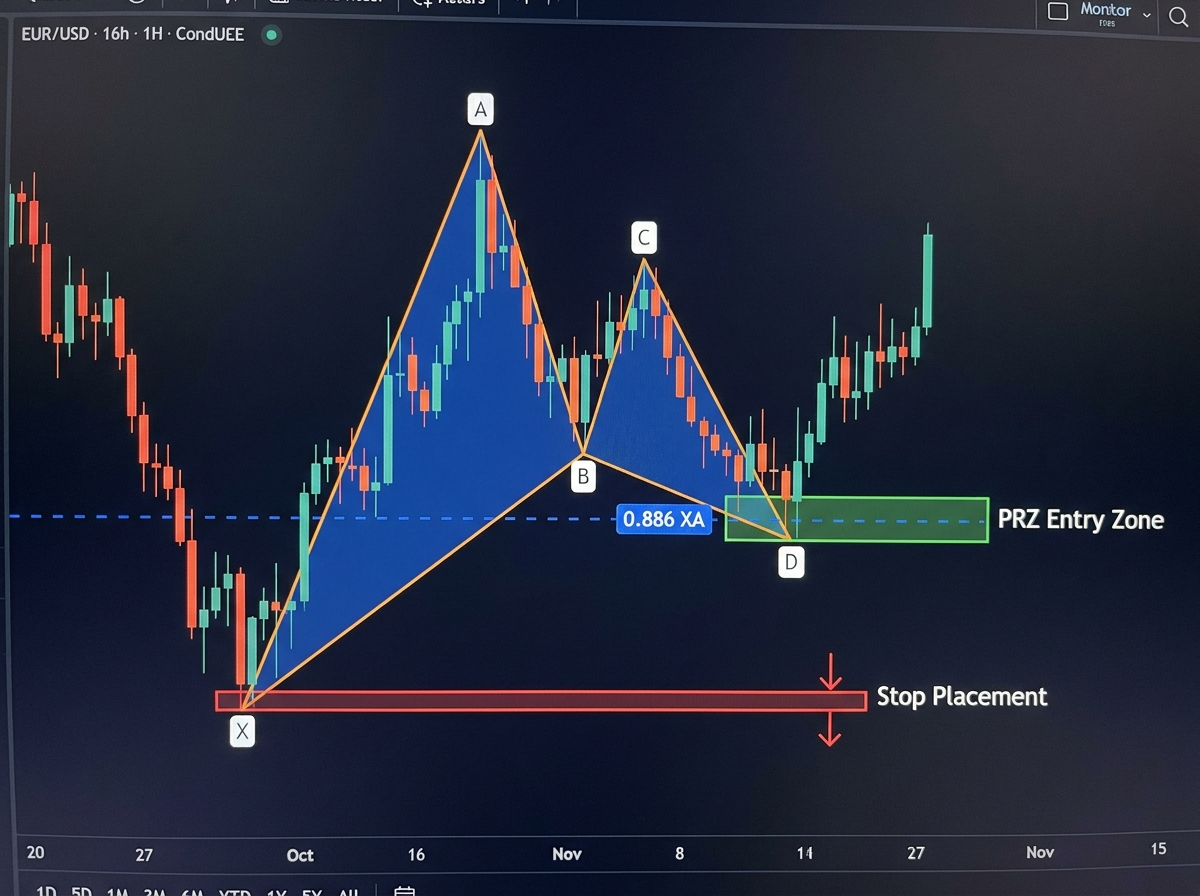
| Bat Pattern | Deep retracement reversal setup | 0.886 XA retracement |
| Cypher Pattern | Counter-trend reversal with tight PRZ | 0.786 XC retracement |
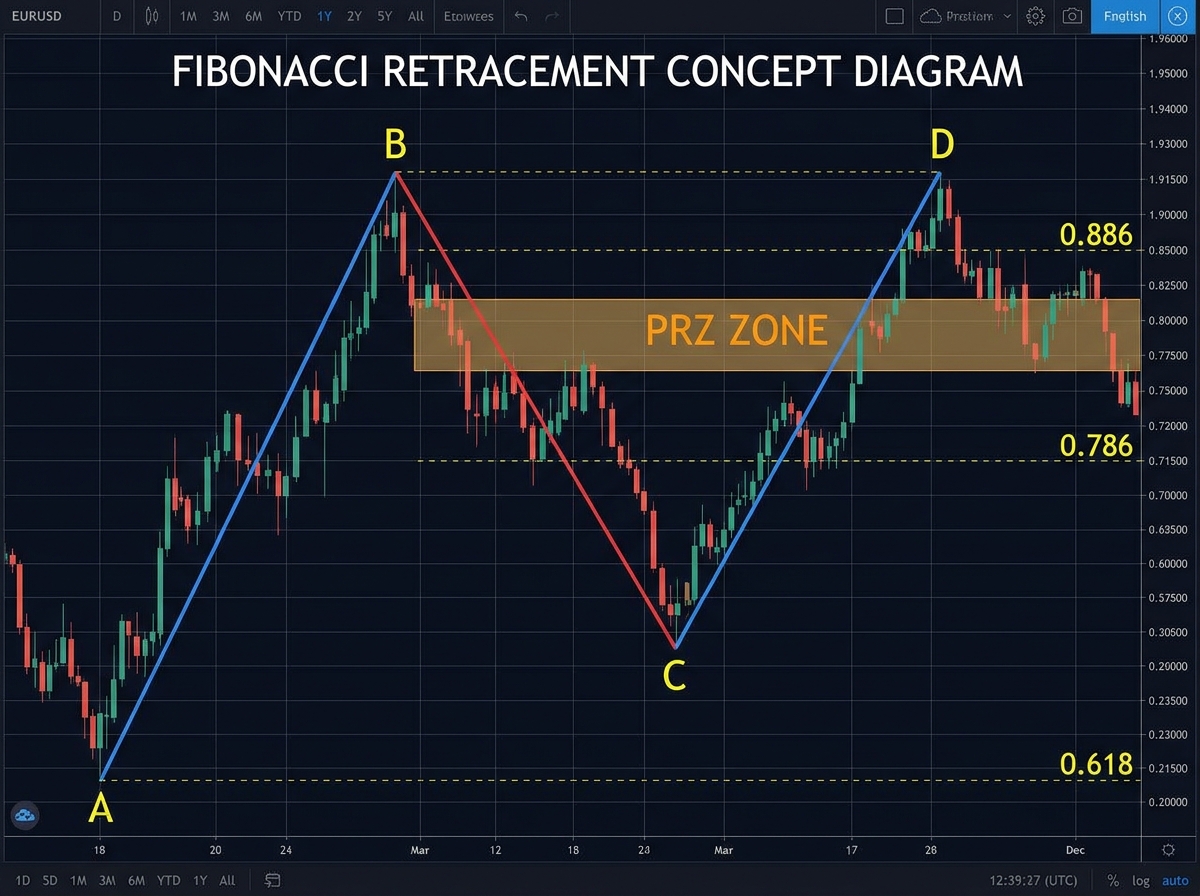
These aren’t random shapes — each one encodes a specific relationship between price swings, defined by Fibonacci ratios. When price completes that relationship, it signals a potential reversal zone called a PRZ (Potential Reversal Zone).
Three Things That Surprised Me Early On
- Fibonacci ratios aren’t magic — they’re the math of market memory.
- A pattern that looks perfect on the left side of the chart means nothing without a PRZ to trade into.
- You can identify a Cypher correctly and still lose if your position size ignores your account size.
How Long This Actually Takes to Learn
| Stage | Content | Time |
|---|---|---|
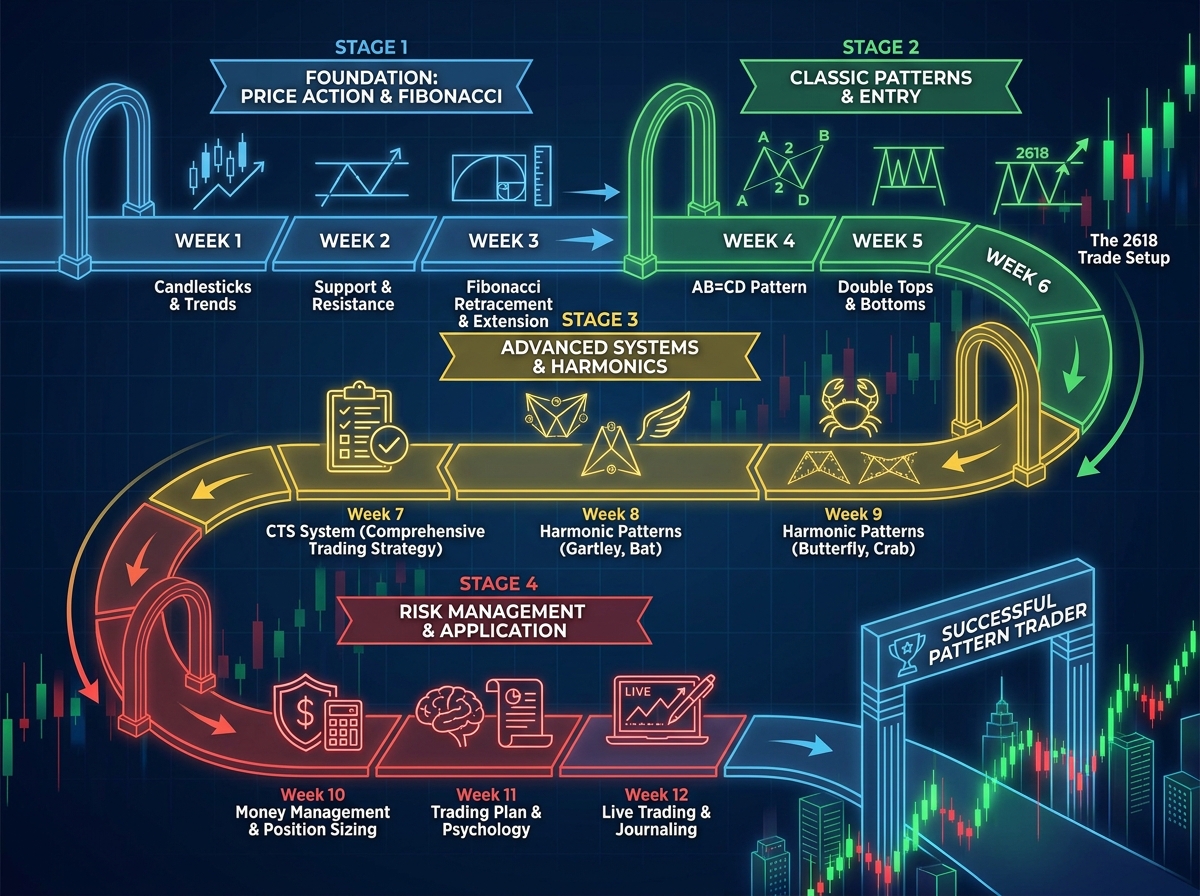
| Foundation | Reading price charts, swing highs/lows, structure | Week 1–2 |
| Pattern basics | AB=CD, Fibonacci ratios, double tops/bottoms | Week 2–4 |
| Intermediate setups | 2618 Trade, CTS System | Week 4–6 |
| Advanced harmonics | Cypher, Gartley “222”, Bat Pattern | Week 6–9 |
| Trade execution | Advanced techniques, structure strategy, money management | Week 9–12 |
| Total | Full beginner-to-advanced cycle | ~12 weeks |
Order matters more than speed here — you cannot shortcut the chart-reading foundation and expect harmonics to make sense later. And if week six takes you three weeks in real life, that’s not failure — the traders who stick with the sequence are the ones who stop second-guessing their entries.
The Foundation Nobody Wants to Spend Time On
Every new trader wants to jump straight to the fancy patterns. That’s the single biggest mistake people make when learning forex pattern trading — they skip chart structure and spend hours drawing Gartley patterns on the wrong side of a trend. The patterns become noise because you don’t yet know which swing highs and lows actually matter.
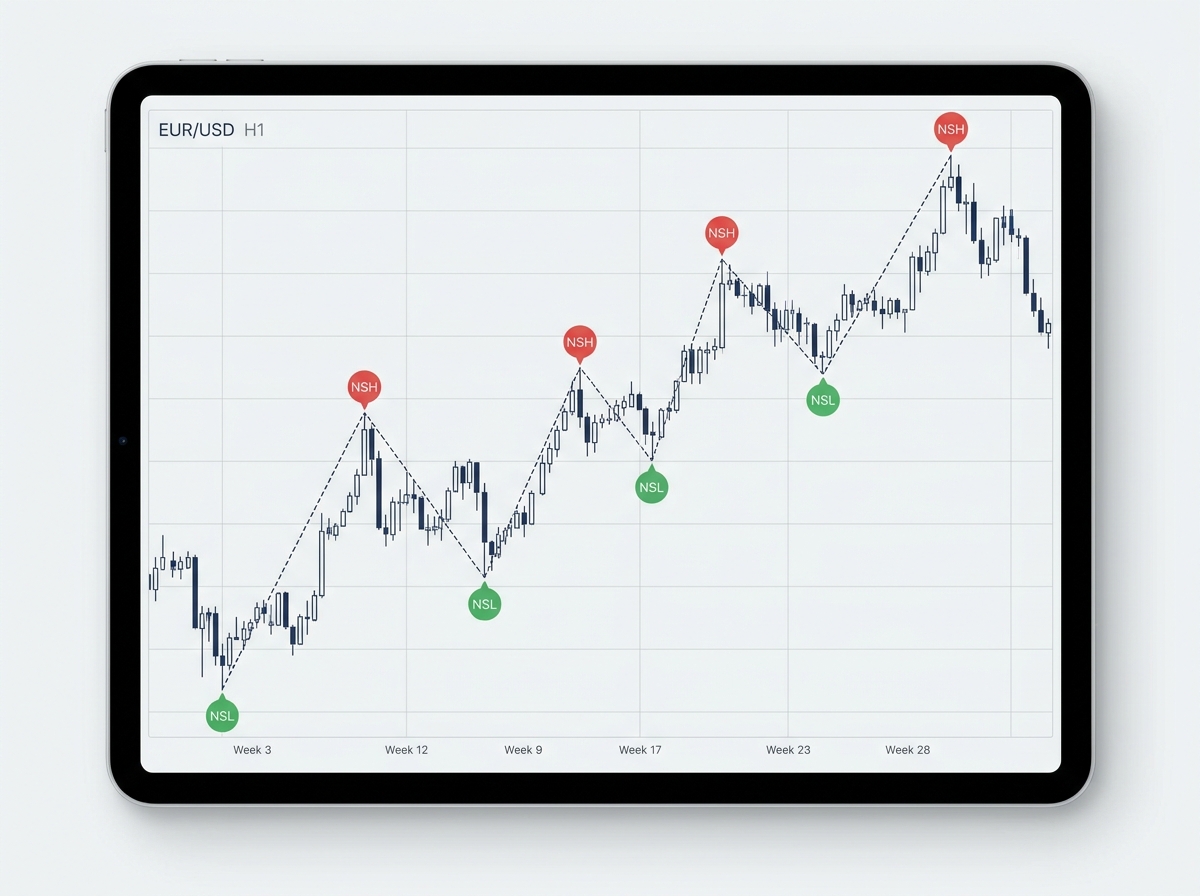
Reading a price chart isn’t about memorizing candle shapes. It’s about training your eye to see structure — where price made a significant high, where it respected a low, where momentum shifted. The NSH (New Swing High) and NSL (New Swing Low) principle is where this starts. Once you can mark those points consistently on any timeframe without hesitation, the rest of the framework has somewhere to attach.
Spend at least two full weeks just doing this — no patterns, no indicators, just marking structure on clean charts. It feels slow and unglamorous. It’s also the thing that separates traders who can read a chart from those who just see noise with lines on it.
When Fibonacci Finally Makes Sense
Fibonacci ratios felt abstract until I started using the AB=CD pattern as a forcing function. The AB=CD is the simplest harmonic setup — it just says that if price moves a certain distance in one direction (the AB leg), it will likely move the same distance again after a pullback (the CD leg). That’s it. That equality constraint is what forces you to actually measure price movement instead of eyeballing it.
Once you’ve drawn a few AB=CD setups correctly, the 0.618 and 0.786 retracements stop being arbitrary percentages and start feeling like natural pause points. You’ll start seeing where price tends to hesitate — and more importantly, you’ll know when it didn’t pause where it should have, which is often more informative than when it did.
For traders who want to go deeper into how Fibonacci tools integrate with broader price analysis, options trading Greeks and implied volatility using Python-first tools explores similar ratio-based thinking applied to derivatives — a useful parallel if you trade across asset classes.
The Patterns That Actually Changed How I Trade
Double Tops and Bottoms are where most forex pattern trading beginners get their first real edge. They’re visible, they’re common, and they’re the setup that teaches you what a failed retest looks like versus a confirmed reversal. The 2618 Trade builds directly on this — instead of entering at the double top neckline break, you wait for a 2.618 extension beyond the pattern’s swing point, then fade the move. That one delay in entry changes your win rate significantly.
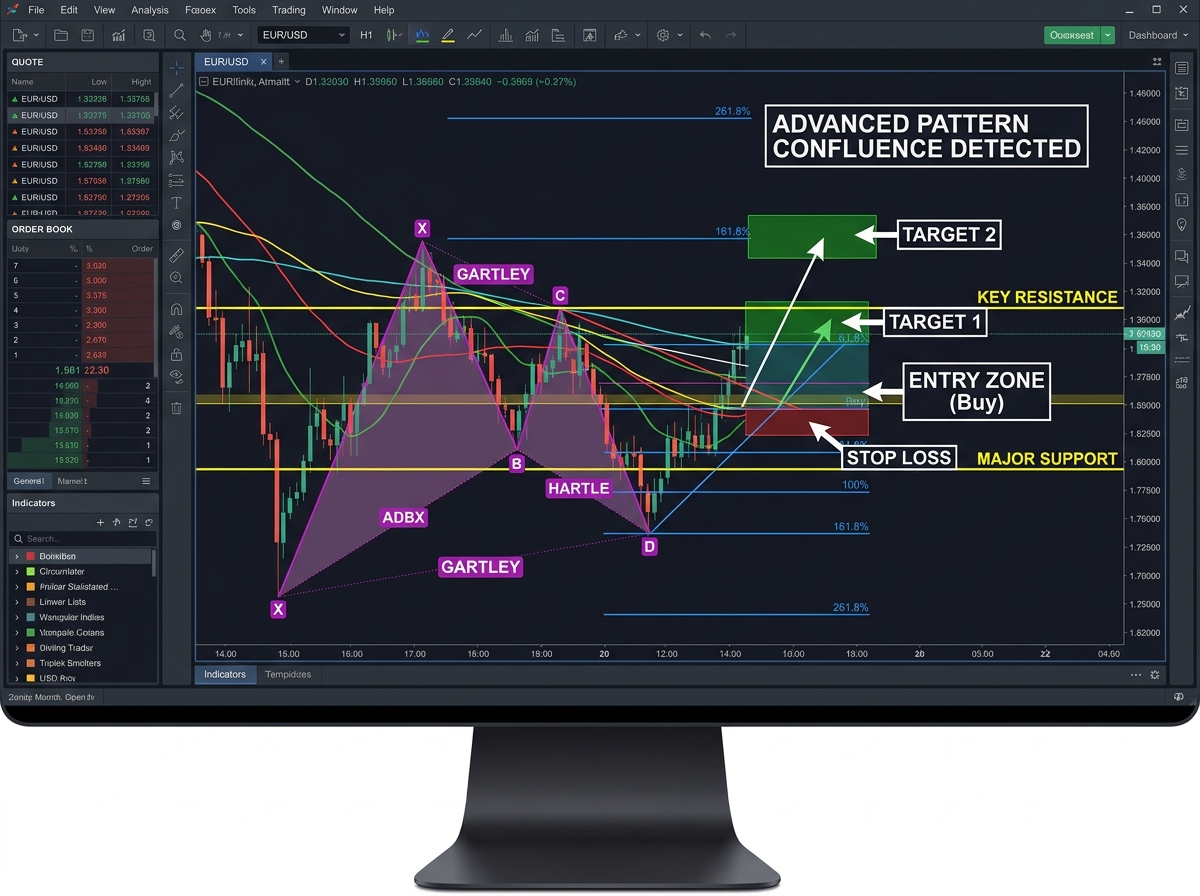
The CTS System introduced the idea of confluence — stacking a pattern signal with a structure level with a Fibonacci ratio, so that no single element is carrying the whole trade. That’s the moment trade planning becomes less about prediction and more about probability stacking.
Then come the advanced harmonic patterns. The Cypher is technically demanding but has a tight PRZ, which means your stop is small relative to your target — structurally one of the best risk-reward setups in pattern trading. The Gartley “222” is older and more widely traded, which means more false completions in trending markets, but also more data to back-test against. The Bat pattern sits between them — a deep 0.886 retracement that catches traders off guard precisely because most people exit the move before it reaches completion.
What the Advanced Stage Is Really About
By week nine, most people think they’re learning more patterns. What’s actually happening is they’re learning to combine everything — structure, Fibonacci, pattern completion — into a single read of the chart. Advanced techniques in forex pattern trading aren’t additive; they’re integrative. The question shifts from “does this pattern exist?” to “does this pattern exist at a level that matters, in the right market context, with favorable risk?”
Price chart structure strategy — reading where the market has stacked previous highs and lows, identifying which levels have been tested multiple times — becomes the filter that separates valid harmonic setups from ones that look textbook-clean but sit in the middle of nowhere. This is the stage where you start rejecting trades, not just finding them, and that rejection habit is what makes the trades you do take more consistently profitable.
If you’re also building a wider technical trading toolkit, mastering forex scalping using fair value gaps and order blocks covers structure-based approaches that pair naturally with harmonic pattern reading, especially for intraday setups.
The Money Management Problem Nobody Fixes Until It’s Too Late
You can identify a perfect Gartley, enter exactly at the PRZ, and still blow 30% of your account on one trade — because you sized your position based on how confident you felt, not on a fixed percentage of your capital.
Money management in forex pattern trading isn’t a separate topic bolted onto the end of strategy. It determines whether you survive long enough to see your edge play out over a sample size that matters. The foundational rules are simple: risk a fixed percentage per trade (1–2% is the standard most professional traders operate within), size your position based on the distance to your stop, and never move your stop to avoid a loss. The hard part isn’t knowing these rules — it’s that every time you’re in a live trade, everything in you wants to break them.
Record keeping is the discipline that fixes this over time. When you’re logging every trade — entry, stop, target, outcome, and what you were thinking when you entered — patterns in your own behavior start to emerge. You’ll notice that you overtrade on Mondays. That you ignore your stop when the trade is almost at target. That your best setups all share the same structure context. That data becomes more valuable than any pattern.
For more on how swing trading strategy and risk management interact in practice, how to learn swing trading with real execution frameworks covers position management principles that apply directly to pattern-based setups.
What I’d Do Differently From Day One
Looking back, most of the time I “wasted” wasn’t on bad strategies — it was on building skills out of order and skipping the boring parts. The traders who get consistently profitable fastest are the ones who treat the foundation with the same seriousness they bring to advanced patterns.
Here’s what actually matters, broken down into actions:
- Start every session by marking structure on a clean chart. Before drawing a single pattern, identify the last three significant swing highs and lows — this keeps you from trading patterns that sit in structurally irrelevant areas.
- Draw every AB=CD setup you can find for 30 days. This one pattern teaches Fibonacci ratios, leg measurement, and entry timing faster than any indicator ever will.
- Set your risk percentage before you open the trade, not after. Decide what 1% of your account looks like in dollar terms, then size your lot based on your stop distance — never the reverse.
- Log every trade with a screenshot at entry and exit. Reviewing these weekly reveals behavioral patterns in your trading that no backtesting tool can show you.
- Trade the Cypher before the Gartley as a beginner. The Cypher’s tighter PRZ forces better discipline around entry precision — habits that make you a better Gartley trader later.
- Backtest each new pattern for at least 50 historical occurrences before trading it live. Fifty isn’t enough for statistical certainty, but it’s enough to feel the false completions and understand what valid setups actually look like in real market conditions.
- Paper trade your trade plan for two full weeks before going live. The emotional experience of watching a paper trade work or fail is enough to reveal whether your plan actually holds up under the pressure of live decision-making.
- Never add to a losing position based on a pattern re-draw. If the original PRZ has been invalidated by price, the trade is over — the urge to “redraw” is almost always rationalization, not analysis.
Leave a Reply